Texas Education Agency
Texas Gateway: Graphing Data to Demonstrate Relationships
Given problem situations, the student will graph data with a constant rate of change to demonstrate relationships in familiar concepts, such as scaling.
Khan Academy
Khan Academy: Unit: Modeling Data Distributions
A complete unit with tutorials, text, and practice over modeling data distributions.
Texas Education Agency
Texas Gateway: Data, Sampling, and Variation in Data and Sampling
This learning module discusses quantitative and qualitative data, the use of two-way tables in marginal and conditional distributions, how to display data, variation in data and samples, and how to critically evaluate statistical...
Texas Education Agency
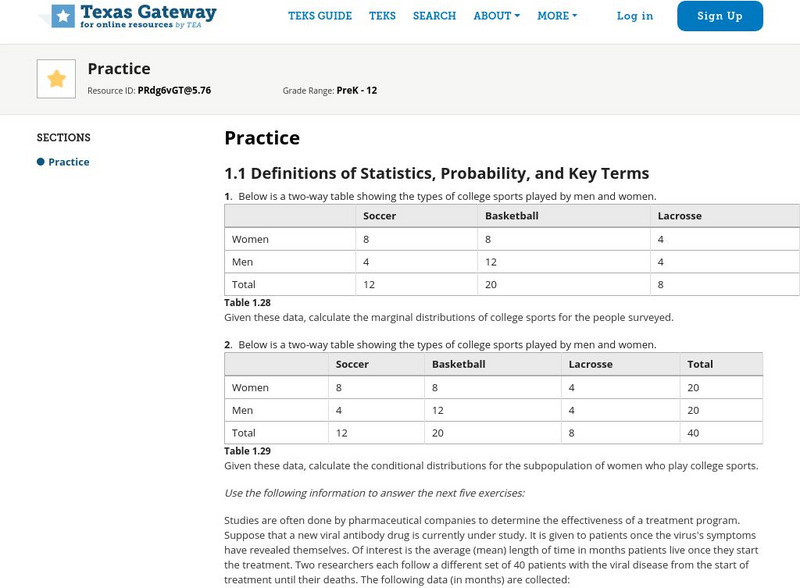
Texas Gateway: Tea Statistics: Sampling and Data: Practice
A set of exercises where students must analyze statistcal data and methodology and answer questions about distributions, sampling, results, accuracy, frequency, experimental design, and ethical practices.
CK-12 Foundation
Ck 12: Types of Data Representation: Graphic Displays of Data
[Free Registration/Login may be required to access all resource tools.] Here you will explore displays of data using bar charts, histograms, pie charts and boxplots, and learn about the differences and similarities between them and how...
Cuemath
Cuemath: Frequency Distribution Table
A comprehensive guide for learning all about frequency distribution tables with definitions, how to create a frequency distribution table, and the formulas and graphs related to frequency distributions. With solved examples and...
US Census Bureau
Us Census Bureau: International Data Base
Statistical data on the population and demographics of 228 countries, including change, sex ratios, life expectancy, and percent with HIV/AIDS. There are also detailed explanations of the means of producing these statistics. It is...
Texas Education Agency
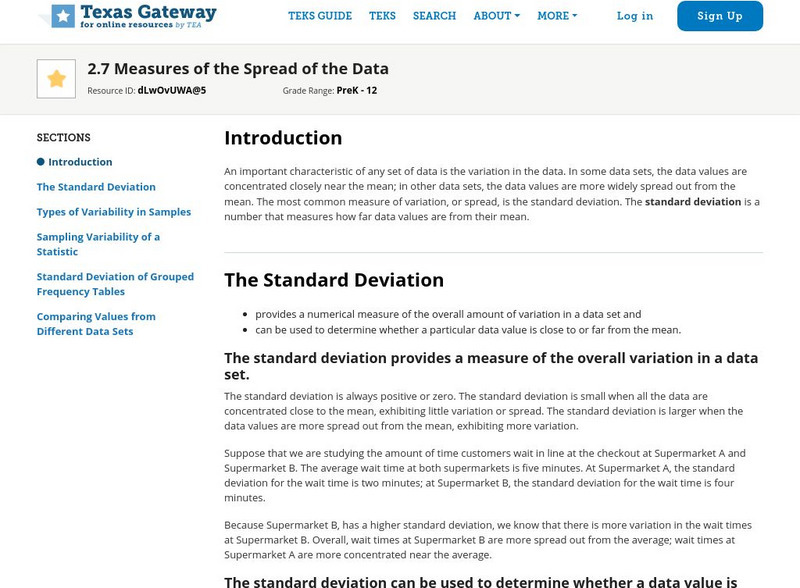
Texas Gateway: Tea Statistics: Measures of the Spread of the Data
This resource explains the different measures of center, variability, etc. that are used to describe the spread of statistical data. Includes examples and practice exercises.
Texas Education Agency
Texas Gateway: Predicting, Finding, and Justifying Data From Verbal Descriptions
Given data in a verbal description, the student will use equations and tables to solve and interpret solutions to problems.
Quia
Ixl Learning: Frequency Tables
Brush up on your math skills relating to frequency tables then try some practice problems to test your understanding.
CK-12 Foundation
Ck 12: Graphic Displays of Data
[Free Registration/Login may be required to access all resource tools.] In this lesson, students compare different types of graphic displays to understand how to choose the best method of displaying their data, and they learn the...
University of Texas
Inside Mathematics: Our Pets [Pdf]
This task challenges a student to demonstrate understanding of concepts involved in representing and interpreting data.
University of Texas
Inside Mathematics: Parking Cars [Pdf]
This task challenges a student to use their understanding of scale to read and interpret data in a bar graph.
University of Auckland School of Computer Science
Morris: Hash Tables
A description of hash tables and how they are created.
Web Elements
Web Elements Periodic Table: Iridium
WebElements offers valuable information on iridium, with basic data, chemical and physical properties, electron arrangement and more. A helpful site.
Microsoft
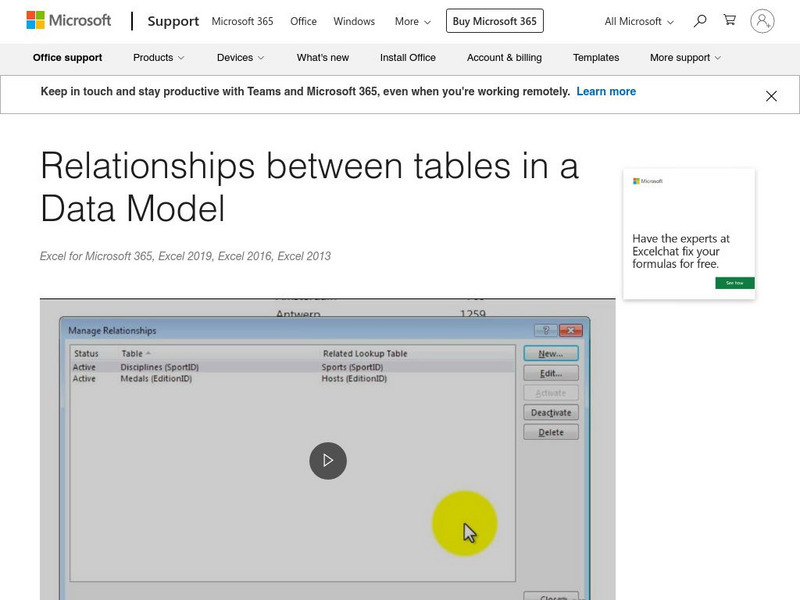
Microsoft: Relationships Between Tables in a Data Model
Add more power to your data analysis by creating relationships among different tables. A relationship is a connection between two tables that contain data: one column in each table is the basis for the relationship. To see why...
Better Lesson
Better Lesson: Making a Table
First graders get a chance to use tables when breaking a total quantity into its component parts.
Better Lesson
Better Lesson: Graphing Using a Frequency Table
Multiple graphs can represent the same data set and make the information easier to understand.
Khan Academy
Khan Academy: Linear vs. Exponential Growth: From Data
Given a table with values of two quantities over time, determine whether the quantities form grow linearly or exponentially.
Other
Learn to Code With Me: The 4 Data Structures Every New Developer Should Know
Learn about the four data structures evident inbn computer programming.
Shodor Education Foundation
Shodor Interactivate: Plop It!
PlopIt allows users to build dot plots of data using the mouse. View how the mean, median, and mode change as entries are added to the plot.
National Snow and Ice Data Center
Nat. Snow and Ice Data Center: All About Glaciers: Where Are Glaciers Located?
Explains where glaciers can be found and what conditions are needed for them to exist. Includes a table showing where glaciers can be found around the world and the approximate areas. These figures were, however, from 2008.
University of Texas
Inside Mathematics: Granny's Balloon Trip [Pdf]
This task challenges a student to use knowledge of scale to organize and represent data from a table on a graph.
McGraw Hill
Glencoe: Self Check Quizzes 1 Using Graphs to Make Predictions
Use Glencoe's randomly generated self-checking quiz to test your ability to use graphs to make predictions. Each question has a "Hint" link to help. Choose the correct answer for each problem. At the bottom of the page click the "Check...


