Hi, what do you want to do?
Houghton Mifflin Harcourt
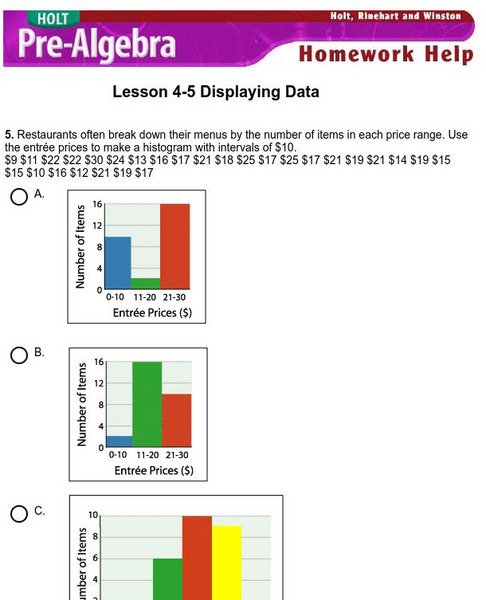
Holt, Rinehart and Winston: Homework Help Independent Practice: Displaying Data
Get independent practice displaying data. Each incorrect response gets a text box explanation and another try. Correct responses are confirmed.
Khan Academy
Khan Academy: Calculating the Mean From Data Displays
In this exercise, students practice calculating the mean from data displays. Students receive immediate feedback and have the opportunity to get hints and try questions repeatedly.
Louisiana Department of Education
Louisiana Doe: Louisiana Believes: Eureka Math Parent Guide: Collecting and Displaying Data
A guide to support parents as they work with their students in collecting and displaying data.
Texas Instruments
Texas Instruments: Mc Dougal Littell Middle School Math: Making Data Displays
Students will create data displays using a scatter plot and a line graph of the data and a circle graph of survey data.
Government of Alberta
Learn Alberta: Math Interactives: Exploring Election Data
Using actual Alberta provincial election results, students have the opportunity to interpret election data using a variety of graph types. Pictographs, line graphs, bar graphs, circle graphs, and data tables are covered in this...
Khan Academy
Khan Academy: Calculating the Median: Data Displays
Practice computing the median of data sets presented in a variety of formats, such as frequency tables and dot plots. Students receive immediate feedback and have the opportunity to try questions repeatedly, watch a video or receive hints.
CK-12 Foundation
Ck 12: Elem Math: Length Comparisons Using Data Tables
[Free Registration/Login may be required to access all resource tools.] The video shows how to use a data table to answer questions comparing length.
Khan Academy
Khan Academy: Analyzing Energy for a Simple Harmonic Oscillator From Data Tables
Use your knowledge of simple harmonic oscillator to analyze energy from experimental data with these practice problems.
Government of Alberta
Learn Alberta: Math Interactives: Exploring Data Display and Graphs
This multimedia Learn Alberta math resource focuses on graphing data. In the video portion, students will see how math is involved in the display of merchandise in stores. The accompanying interactive component provides an exploration...
BBC
Bbc: Ks1 Bitesize: How to Use Simple Data Tables
Explains how to read information from a simple golf scoring table. Students then label the rows and columns in a 2x3 table. [0:26]
CK-12 Foundation
Ck 12: Statistics: Displaying by Type of Data Grade 8
[Free Registration/Login may be required to access all resource tools.] Create and use different data displays to analyze and draw conclusions about different sets of data.
Other
Online Statistics Education: Graphing Distributions [Pdf]
This is the second chapter of a statistics e-text developed collaboratively by Rice University, University of Houston Clear Lake, and Tufts University. It looks at many different types of data displays and the advantages and...
Texas Education Agency
Texas Gateway: Selecting and Using Representations for Collected Data
[Accessible by TX Educators. Free Registration/Login Required] Given a variety of data (including line plots, line graphs, stem and leaf plots, circle graphs, bar graphs, box and whisker plots, histograms, and Venn diagrams), the student...
Texas Education Agency
Texas Gateway: Scientific Investigation and Reasoning Data Organization
Using interactive exercises, students will review how to construct tables and graphs in order to organize data.
CK-12 Foundation
Ck 12: Frequency Tables to Organize and Display Data Grade 7
[Free Registration/Login may be required to access all resource tools.] Make a frequency table to organize and display data.
Other
Nearpod: Displaying Data: Dot Plots
In this lesson, students will learn how to create and intrepret dot plots.
Khan Academy
Khan Academy: Creating Frequency Tables
Practice creating frequency tables from small data sets. Students receive immediate feedback and have the opportunity to try questions repeatedly, watch a video or receive hints.
Other
Nearpod: Displaying Data: Box Plots
For this lesson, students will learn how to create and intrepret box plots using the 5-number summary.
CK-12 Foundation
Ck 12: Statistics: Circle Graphs to Display Data Grade 7
[Free Registration/Login may be required to access all resource tools.] Make circle graphs by using given data.
National Council of Teachers of Mathematics
Nctm: Illuminations: State Data Map
Data can be displayed in a variety of ways. This interactive map of the United States shows data by degrees of color. Choose to display data such as: land area, population, population density, gas use, and much more.
E-learning for Kids
E Learning for Kids: Math: Elephant Plant: Data
Gyan's family grows flowers. Can you help him interpret displayed data about their plants?
Oswego City School District
Regents Exam Prep Center: Practice With Organizing and Interpreting Data
Several problems are presented to test your skills in creating and interpreting frequency tables, pie charts, box-and-whisker and stem-and-leaf plots.
CK-12 Foundation
Ck 12: Analyzing Data
[Free Registration/Login may be required to access all resource tools.] Students will learn how to choose a type of data visualization based on the kind of data they have collected and the objective of their research.
Louisiana Department of Education
Louisiana Doe: Louisiana Believes: Eureka Math Parent Guide: Problem Solving With Length, Money, and Data
A guide to support parents as they work with their students with problem solving with length, money, and data.


