Curated OER
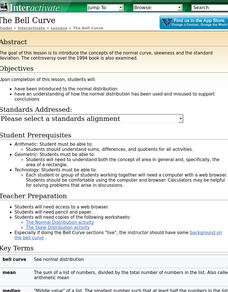
The Bell Curve
Students are introduced to the normal distribution and examine the bell curve controversy.
Curated OER
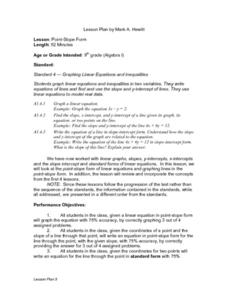
Point-Slope Form
Ninth graders explore the point-slope form of linear equations and graph lines in the point-slope form. After completing the point-slope equation, they identify the slope of a line through a particular point. Students explain the...
Curated OER
Education for Global Peace
Learners survey the class and graph the results. In this graphing and data collection lesson, students conduct a survey to see where their shirts were produced. Individuals use software to graph the results and create a written...
Curated OER
Normal Distribution
Students complete problems on normal distribution equations. In this algebra lesson plan, students complete 11 problems out of their text book.
Curated OER
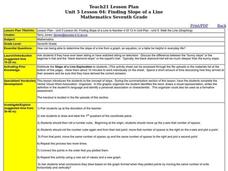
Finding Slope of a Line
Students calculate the slope of a line. In this algebra lesson, students graph a line using the slope and y-intercepts. They define the steepness of the line using the slope.
Curated OER
Who Does the Lottery Benefit?
Students investigate the pros and cons of the lottery. In this algebra lesson, students use the formulas for permutation and combination to test their arguments about the lottery. They collect data about their argument and plot it on a...
Curated OER
Introduction to Scatter Plots and Correlation
Students examine the concept of scatter plots. They compare baseball statistics to locate the ones that correlate with winning, and identify the positive, negative, and no correlation in sets of data using MS Excel.
Other popular searches
- Discrete Mathematics Graph
- Discrete Mathematics Grade 5
- History Discrete Mathematics
- Discrete Mathematics Lecture
- Discrete Mathematics Trees
- Discrete Mathematics Grade 8
- Discrete Mathematics Graf
- Discrete Mathematics Graft


