Curated OER
Quantitative Data
In this quantitative data worksheet, pupils compute measures of central tendency, draw vertical line diagrams, and compare collected data. This 23-page worksheet contains approximately 100 multi-step problems. Explanations and examples...
Curated OER
Data Collection and Presentation
Middle and high schoolers collect and analyze data from four different activities. The activities include information about classmates, tallying colors of cars in a parking lot, stem and leaf plots, and making a histogram from...
Curated OER
Presentation of Quantitative Data- Vertical Line Diagrams
In this quantitative data worksheet, students examine how vertical line diagrams can be used to display discrete quantitative data. They read about the use of tally charts to create vertical line graphs that display the data. They...
Curated OER
Data Management and Probability: Applications
In this data management and probability applications worksheet, 8th graders solve 20 various types of probability problems. They find the mean, median, mode and range of various numbers. Then, students use the spinner illustration to...
EngageNY
Modeling a Context from Data (part 1)
While creating models from data, pupils make decisions about precision. Exercises are provided that require linear, quadratic, or exponential models based upon the desired precision.
Curated OER
Making Predictions from Data with a Graphing Calculator
In this making predictions from data worksheet, students solve 15 short answer problems. Students determine average miles per gallon given data on miles traveled and gas used. Students make predictions using the data and a line of best fit.
Curated OER
Frequency Tables; Discrete Ungrouped Data
In this frequency tables activity, students utilize given data to work out three frequency charts with one containing values and a pie chart involving angles for each value. Students complete three vertical line diagrams and check all...
Curated OER
Types of Data
In this data chart instructional activity, students read the directions and study the examples to learn the difference between qualitative, quantitative, discrete and continuous data. Students answer 24 questions. This page is intended...
Curated OER
Handling Data- Health Statistics
In this social studies worksheet, students organize 50 country cards into groups. Students analyze a chart and group countries according to lowest, middle, and highest Infant Mortality Rate.
EngageNY
From Ratio Tables, Equations and Double Number Line Diagrams to Plots on the Coordinate Plane
Represent ratios using a variety of methods. Classmates combine the representations of ratios previously learned with the coordinate plane. Using ratio tables, equations, double number lines, and ordered pairs to represent...
Curated OER
Mean, Median, and Mode for Frequency Tables
In this mean, median, and mode activity, students solve 10 short answer problems. Kids find the mean, median, and mode of various data sets. Students make frequency tables from the data sets.
Curated OER
Let's Flip a Coin
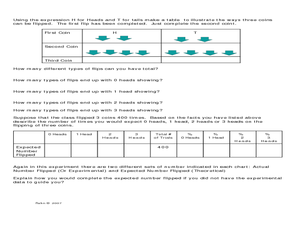
For this probability worksheet, learners use a TI graphing calculator to simulate flipping a coin and compare their results (experimental probability) to the expected results (theoretical probability). The five page worksheet...
Virginia Department of Education
Normal Distributions
Pupils work to find probabilities by using areas under the normal curve. Groups work to calculate z-scores and solve real-world problems using the empirical rule or tables.
Curated OER
Recycling Statistics
For this environment worksheet, students look for the answers to the environmental impact of recycling in Great Britain with the statistics from the pie graph.


