Bowels Physics
Direct and Inverse Relationships
Viewers learn to recognize direct and inverse relationships in the world of physics with a presentation that reveals how to recognize a direct versus an inverse relationship from a formula or graph. After showing basic examples, the...
Chicago Botanic Garden
Plant Phenology Data Analysis
Beginning in 1851, Thoreau recorded the dates of the first spring blooms in Concord, and this data is helping scientists analyze climate change! The culminating instructional activity in the series of four has pupils graph and analyze...
Curated OER
Regents High School Examination: Living Environment 2007
Environmental science enthusiasts show what they know at the end of the year by taking this full-fledged final exam. They answer multiple choice, graph interpretation, and essay analysys questions, 73 of them in all. Topics range from...
Curated OER
Regents High School Examination: Living Environment 2009
Emerging ecologists need a full understanding of life, from the inner workings of a cell to the complex relationships among organisms. This examination is meant to assess high schoolers after an entire year course on the living...
Curated OER
Adaptations to Niches and Habitats
Life science learners measure and record traits of seeds, leaves, and their own hands and then graph the data to find a continous distribution curve. They compare and color diagrams of seven different animals' forelimbs (not included),...
Curated OER
Genetic Variations in Hand Span Size
Students study genes. In this biology lesson plan, students measure their handspan size to determine if one pair or many pairs of genes control that trait.
Curated OER
Tides & Lunar Cycles
Students demonstrate how the moon affects the tides, a neap tide, and spring tides by using their bodies as models. After students observe the model they created, they draw and label the diagram on a provided worksheet. They then log...
Curated OER
Teaching about Diel Temperature Variation
Students explore temperature variation in lakes and deal with the data.
Curated OER
Canada's Climate: Temperature and Rainfall Variations
Students analyze data about various climates in Canada. In this data analysis and climate activity, students use Canada Year Book 1999 to complete a worksheet and make connections between precipitation and temperature in different climates.
Curated OER
Cancer: A Crisis of the Cells
Students analyze cancer data represented in graphs and charts. They describe the changes in cell structure and function as the result of cancer. They also examine phenomenas that are believed to cause cancer.
Curated OER
Manatee Awareness Survey
Students examine the public's awareness of manatees by taking a survey. They display the results of the survey as a graph.
Curated OER
Regents High School Examination: Living Environment 2010
This exam touches upon every topic within the typical first year biology course.. A broad variety of question styles give high schoolers every opportunity to show what they know. Why start from scratch when a comprehensive final exam is...
Virginia Department of Education
Adaptation and Evolution
Um may be the atomic symbol for confusion, but it won't be needed in this lesson. Scholars rotate through seven stations completing experiments, hands-on activities, writing exercises, and analysis. Stations include material on...
Curated OER
Temperature Graphing
Pupils analyze temperature variations throughout the world by using computer graphing of select major national and international cities. After analyzing their findings, students write a paragraph explaining their data.
Curated OER
Seasons
Students investigate the reason for seasons on Earth during three activities. They construct a model of the Earth and Sun to identify patterns in the changes of the angle of light on the Earth's surface. Then they conduct a heat...
Curated OER
Cookie Mapping
Students study the components of a bedrock geology map through a hands-on activity involving a cookie and graph paper.
Curated OER
Temperature High and Lows
Students gather high and low temperature readings through email. In this temperature graphing lesson, students use a spreadsheet to input data for a graph. students interpret the graphs to compare and contrast the data from different...
Curated OER
More Rocket Science
Students observe two rocket science experiments, and create a graph to demonstrate the results. They draw a picture and write an explanation of the results of the experiments.
Curated OER
PLANETS IN PROPORTION
Students discover scales for both the solar bodies' relative sizes and their distances from the sun. They find equatorial circumference and volumes of their solar bodies. Students apply estimation strategies and proportioanl reasoning to...
Curated OER
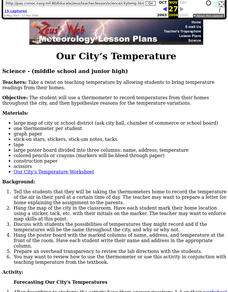
Our City's Temperature
Students use a thermometer to record temperatures from their homes throughout the city, and then hypothesize reasons for the temperature variations. They use a weather graph worksheet that's imbedded in this instructional activity to...
Curated OER
Connecticut Wildlife: Biodiversity and Conservation Status of Our Vertebrate Populations
Students explore the different types of vertebrates found in their area. In this environmental science lesson, students perform a case study on the Common Raven. They analyze data collected from research and create charts and graphs.
Curated OER
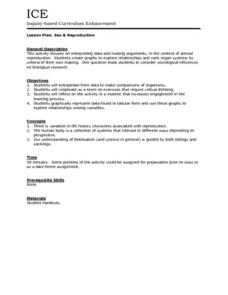
Sex & Reproduction
Students examine animal reproduction by interpreting data and making arguments and then create their own graphs to explore relationships of organ systems. This lesson includes an individual worksheet and a reflective review question for...
Curated OER
$$$eaweed
Students compare and evaluate the world's different seaweeds. In this investigative instructional activity students study seaweed and the harvesting of it. They then interpret the data collected and graph the seaweed...
Curated OER
Fish Parasite Survey
Students survey and dissect as many fish as possible. They count nematodes, cestodes and crustaceans on the fish, fill out autopsy reports, and transfer data to a chalkboard data table. Students graph the results of the entire class...


