Curated OER
Exponential Functions
Analyze functions by their shape and equation and identify decay and growth based on the equation given. Learners graph their exponential functions and differentiate it using the logarithmic versus the exponential function.
Virginia Department of Education
Adaptation and Evolution
Um may be the atomic symbol for confusion, but it won't be needed in this lesson. Scholars rotate through seven stations completing experiments, hands-on activities, writing exercises, and analysis. Stations include material on...
Curated OER
Understanding "The Stans"
Students explore and locate "The Stans" in Central Asia to create, write and illustrate maps, graphs and charts to organize geographic information. They analyze the historical and physical characteristics of Central Asia via graphic...
Curated OER
Investigating Velocity Effects at Takeoff
Young scholars use, with increasing confidence, problem-solving approaches to investigate and explain mathematical content. They make and test conjectures. They use tables and graphs as tools to interpret expressions, equations, and...
Curated OER
Temperature Graphing
Pupils analyze temperature variations throughout the world by using computer graphing of select major national and international cities. After analyzing their findings, students write a paragraph explaining their data.
Curated OER
Calculus Games
In this calculus worksheet, students rewrite a word problem using algebraic symbols and calculate the derivative of a function to find the correct solution. There are 20 matching questions with an answer key.
Curated OER
Seasons
Students investigate the reason for seasons on Earth during three activities. They construct a model of the Earth and Sun to identify patterns in the changes of the angle of light on the Earth's surface. Then they conduct a heat...
Curated OER
Cookie Mapping
Students study the components of a bedrock geology map through a hands-on activity involving a cookie and graph paper.
Curated OER
Temperature High and Lows
Students gather high and low temperature readings through email. In this temperature graphing lesson, students use a spreadsheet to input data for a graph. students interpret the graphs to compare and contrast the data from different...
Curated OER
Asthma Survey
Students collect survey data on the prevalence of asthma in a community. They summarize and display the survey data in ways that show meaning.
Curated OER
More Rocket Science
Students observe two rocket science experiments, and create a graph to demonstrate the results. They draw a picture and write an explanation of the results of the experiments.
Curated OER
PLANETS IN PROPORTION
Students discover scales for both the solar bodies' relative sizes and their distances from the sun. They find equatorial circumference and volumes of their solar bodies. Students apply estimation strategies and proportioanl reasoning to...
101 Questions
Electric Bill
A brilliant resource is at your disposal. Future consumers investigate and discuss an electric bill. Given only partial information, they estimate the monthly bill. They then consider how tiered pricing will affect the bill.
Curated OER
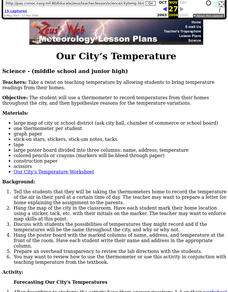
Our City's Temperature
Students use a thermometer to record temperatures from their homes throughout the city, and then hypothesize reasons for the temperature variations. They use a weather graph worksheet that's imbedded in this instructional activity to...
Curated OER
Stuffed Animals Measuring
Students measure stuffed animals with various materials such as dog biscuits, paper clips, and yarn. In this measurement activity, students measure the stuffed animals, and understand the concept of long and short and big and little.
Curated OER
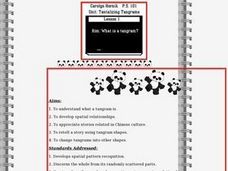
What is a Tangram?
Students identify a tangram. In this geometry lesson, students read Grandfather Tang's Story and retell each story using the tangrams on a flannel board. Students use tangrams to complete an included worksheet.
Curated OER
Connecticut Wildlife: Biodiversity and Conservation Status of Our Vertebrate Populations
Students explore the different types of vertebrates found in their area. In this environmental science lesson, students perform a case study on the Common Raven. They analyze data collected from research and create charts and graphs.
Curated OER
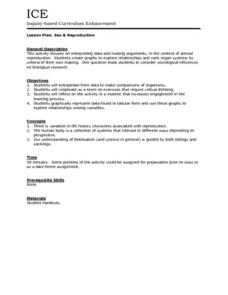
Sex & Reproduction
Students examine animal reproduction by interpreting data and making arguments and then create their own graphs to explore relationships of organ systems. This lesson includes an individual worksheet and a reflective review question for...
Curated OER
Picnic Possibilities
Fourth graders plan a picnic using weather data. Using accumulated weather data from various sources, they create a graph of the weather conditions in their region for a given period of time. Students interpret this data to predict the...
Curated OER
$$$eaweed
Students compare and evaluate the world's different seaweeds. In this investigative instructional activity students study seaweed and the harvesting of it. They then interpret the data collected and graph the seaweed...
Curated OER
Fish Parasite Survey
Students survey and dissect as many fish as possible. They count nematodes, cestodes and crustaceans on the fish, fill out autopsy reports, and transfer data to a chalkboard data table. Students graph the results of the entire class...
Curated OER
Technology - Chaos Theory Lab
Ninth graders gain an understanding of Chaos Theory that exists in one's everyday environment.
Curated OER
From Playing with Electronics to Data Analysis
Students collect and Analyze data. In this statistics instructional activity, students identify the line of best fit of the graph. They classify lines as having positive, negative and no correlation.
Curated OER
Mathematical Models with Applications: The Sounds of Music
Students use an electronic data-collection device to model the sound produced by a guitar string. They identify the graph of a periodic situation and use the graph to determine the period and frequency of sound waves.


