Curated OER
Modern Physics, QM
In this physics worksheet, young scholars examine the theory of quantum mechanics through the answering of the nine questions. The answers are accessed through the links by each question.
Curated OER
The Statistical Nature of Test Data
Students investigate the properties of various metals. They conduct an experiment and gather the data by putting into the proper statistical graphs. The data is analyzed and conclusions are formed according to the properties of the metals.
Illustrative Mathematics
Do You Fit In This Car?
A short activity that focuses on the normal distribution as a model for data distribution. Using given means and standard deviations, your budding statisticians can use statistical tables, calculators, or other statistical software to...
Curated OER
Weather temperatures
Students investigate the given statistics about temperatures in cities around the nation in order to look for a pattern. They measure the mean, median, and mode for the data set of temperatures.
Curated OER
Statistical Analysis For Graphing Calculators
Learners analyze date from the Chesapeake Bay. Using a graphing calculator, they enter the data, plot three temperatures, and create a Box and Whisker plot.
Curated OER
Statistically Lyrical
Students examine and discuss the writing of ratios as fractions and where they can be found in the real world. They complete worksheets and a questionnaire, and calculate the mean, median, and mode scores for the class.
Curated OER
Jazz Forms and Improvisation
Students listen to an original recording of Louis Armstrong and discuss instrumentation. They identify an AABA song form as they listen. They list similarities between the following: traditional meets modern and small group vs. big band.
Curated OER
Z-Scores
Students solve problems by identifying the percent of area under the curve. In this statistics lesson, students discuss z-scores as they calculate the different percentages under the bell curve. They calculate the standard deviation.
Curated OER
Genetics: Who are you?
Study, manipulate, and research genetic traits. Discuss how genetic traits are passed from one generation to another. Classmates explore how they look like their parents and debate whether or not they can do anything about it? They...
Statistics Education Web
Consuming Cola
Caffeine affects your heart rate — or does it? Learners study experimental design while conducting their own experiment. They collect heart rate data after drinking a caffeinated beverage, create a box plot, and draw conclusions....
Curated OER
Center and Spread
Students collect and analyze data. In this statistics lesson plan, students define and calculate the range, median and standard deviation. They identify reasons for a skewed distribution.
Curated OER
Significant Science: Statistics for Planet Earth
Ninth graders discover how statistics are used to interpret results of scientific experiments. Students write hypotheses and test the hypotheses by collecting data and organizing the data. Students graph their data to produce a visual....
Curated OER
What is a P-value?
Students test the hypotheses using p values. In this statistics instructional activity, students define and examine conditional probability. They test each statement for a true statement or a false statement, based on the sample size.
Curated OER
Stemmin'-n-Leafin'
Students make stem and leaf charts to determine the measures of central tendency using test score data. They analyze the data to draw inferences which they share with the class. They complete the associated worksheets.
Curated OER
Being an Educated Consumer of Statistics
Students examine kinds of data used to report statistics, and create their own statistical report based on any of the four sources of media information (Internet, newspaper, TV, magazine).
Curated OER
View Tube Triangulation
Students investigate a particular object then calculate to find the class average and standard deviation. In this measuring distance activity students list their calculations on a piece of paper.
Curated OER
US Historical Climate: Excel Statistical
Students import US Historical Climate Network mean temperature data into Excel from a station of their choice. They are guided through the activity on how to use Excel for statistical calculations, graphing, and linear trend estimates.
Curated OER
Lyrics Statistics
Students describe, analyze and generalize relationships, patterns, functions using words. symbols, variables, tables and graphs.
Sophia Learning
Sophia: Standard Deviation
Students learn how to calculate the standard deviation by hand. Detailed examples that explore how to use the standard deviation formula are included.
University of Hamburg
University of Hamburg: Deviations From Mendelian Laws And: What Is the Meaning of Dominance?
Upper level discussion of several of Mendel's experiments and laws.
Better Lesson
Better Lesson: Mean Absolute Deviation. What Does It Mean?
The students will be working with mean and learning about variability. They will be making connections to real life applications to help assist them in making a connection to mean absolute deviation.
Calculator Soup
Calculator Soup: Standard Deviation Calculator
Standard deviation is a statistical measure of diversity or variability in a data set. A low standard deviation indicates that data points are generally close to the mean or the average value. A high standard deviation indicates greater...
CK-12 Foundation
Ck 12: Algebra Ii: 6.3 Z Scores
See how Z-scores are related to the Empirical Rule from the standpoint of being a method of evaluating how extreme a particular value is in a given set.
Missouri State University
Missouri State University: Introductory Statistics: Statistics
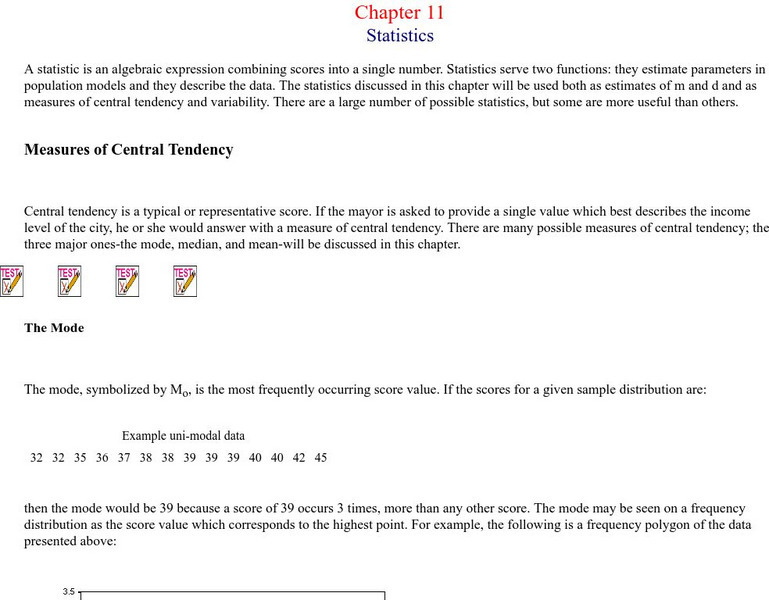
This is an excellent resource on what the science of statistics involves. There are all kinds of definitions, examples, graphs, and charts to learn from. The topics covered include: mode, mean, median, skewed distributions and measures...


