Texas Education Agency
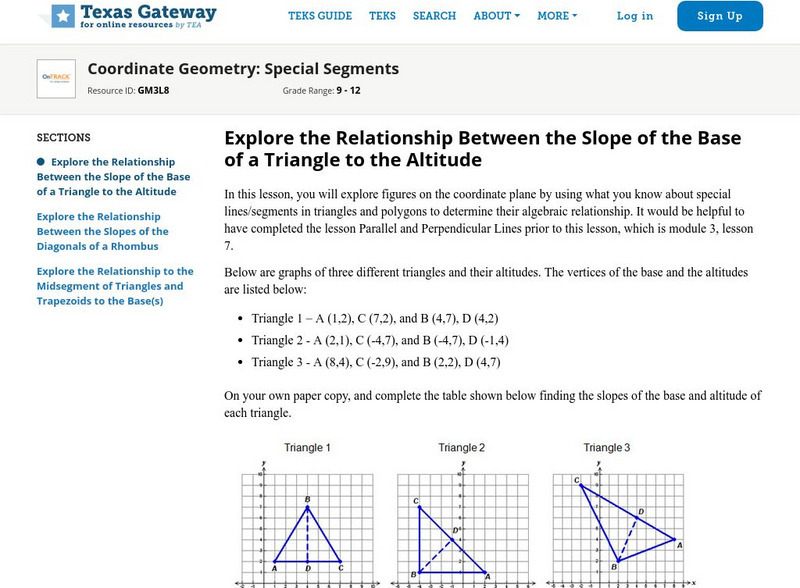
Texas Gateway: Coordinate Geometry: Special Segments
The student will derive and use the slope and midpoint formulas to verify geometric relationship that include parallelism and perpendicularity of lines. Then, the student will determine an equation of a line parallel or perpendicular to...
Texas Education Agency
Texas Gateway: Modeling Data With Linear Functions
Given a scatterplot where a linear function is the best fit, the student will interpret the slope and intercepts, determine an equation using two data points, identify the conditions under which the function is valid, and use the linear...
State University of New York
State University of New York: The Classius Clapyron Equation
The Classius-Clapyron equation can be used to determine the enthalpy of vaporization from vapor pressure measurements over a range of temperatures. In this simulation students are asked to create the appropriate plot of the data and use...
Illustrative Mathematics
Illustrative Mathematics: G Gpe.5 Triangles Inscribed in Circle
In this task, students use ideas about linear functions to determine when certain angles are right angles. They use the fact that two lines (if not vertical or horizontal) are perpendicular when their slopes are inverse reciprocals, as...
Texas Instruments
Texas Instruments: A Sweet Drink Adventure 7
Students determine how the temperature of water affects the dissolving time of a sugar cube. They create, interpret and analyze graphs of data, find an equation of the line of best fit, and relate slope to rate of change.
Texas Instruments
Texas Instruments: Math Today for Ti Navigator System: More Students Apply Early
Using the USA TODAY Infograph, "More students apply early," students will explore scatter plots and independent and dependent variables. Students will determine a best-fit regression model for the real-life data set and then use the...
TeachEngineering
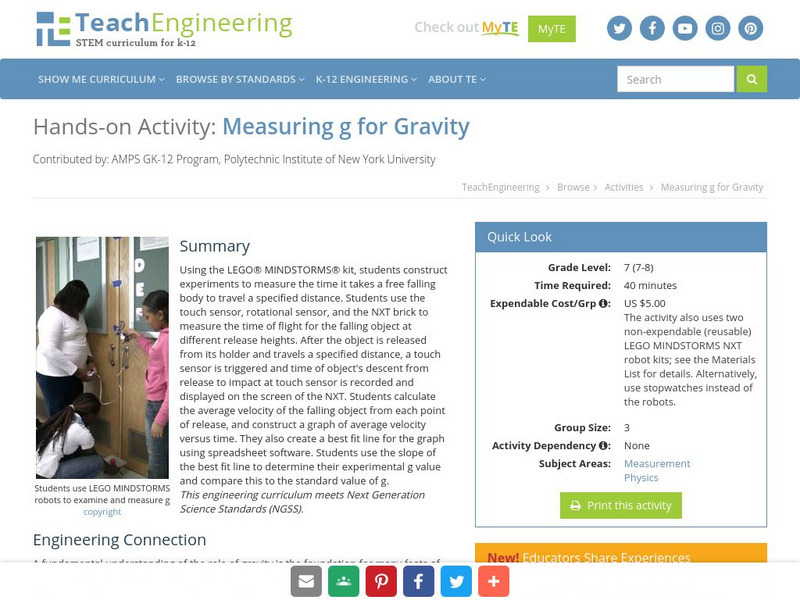
Teach Engineering: Measuring G
Using the LEGO MINDSTORMS NXT kit, students construct experiments to measure the time it takes a free falling body to travel a specified distance. Students use the touch sensor, rotational sensor, and the NXT brick to measure the time of...
OpenStax
Open Stax: Graphical Analysis of One Dimensional Motion
In the following interactive module students will describe a straight-line graph in terms of its slope and y-intercept. They will determine average velocity or instantaneous velocity from a graph of position vs. time.
Other
Ctte: Geometer's Sketch Pad Activities
This site offers numerous activities for middle school and high school students to explore using Geometer's Sketch Pad.


