Curated OER
Trees of Mississippi
Students research tree species found in Mississippi, and record the tree types, numbers of trees, and locations. Students then research the forest industry sites, and determine possible relationships between industry location and tree...
Curated OER
Area Applet
Elementary math classes calculate the area of a shape and explain the correlation between the size of the perimeter and the areas that can be contained within that perimeter. They also explain the effect the shape of the perimeter has on...
Curated OER
Height versus Shoe Size
Students find a correlation between a person's height and his/her shoe size. They have access to entering data into lists on a graphing calculator and can complete scatter plots. Students read and interpret a scatter plot and use the...
Curated OER
How Does the Earth's Energy Budget Relate to Polar Ice?
Students use satellite data to see how radiation budget relates to the ice that is present in the North. In this energy lesson students correlate data to see a relationship.
Teach Engineering
Breathing Cells
Pairs work together to determine whether unknown solutions are either acids or bases by using a red cabbage indicator solution. After determining the general pH of the unknown solution, classmates blow into the same indicator after...
Curated OER
That Is Not My Opinion!
Being an informed citizen requires distinguishing fact from opinion and understanding persuasion methods. Secondary learners evaluate newspaper editorials. They read opinion pieces, identify the writer's purpose and position on an issue,...
Teach Engineering
Solenoids
Metal slinkies, coils of wire, magnetic fields, and MRIs. To determine the safety hazards of MRI machines, class members use the provided formula to calculate the magnetic field along the axis of the solenoid.
Curated OER
Careers With an Aquatic Emphasis
Students are introduced to careers with an aquatic emphasis. They take a self-evaluation test on what they enjoy in school to determine which career is right for them. They listen to people in the field discuss what their job is like.
Curated OER
Variations in Growth and Reproduction of Recently Transplanted Prairie Forbes and Grasses
students recognize and name prairie plants without the use of a key. they determine that prairie plants have different life cycles that affect their rate of growth and reproduction
Curated OER
Eraser Dog: Percents
In this percents worksheet, students solve 30 different problems related to determining percents of numbers. First, they define a percent as a ratio whose second term is 100.
Curated OER
Making Logic Out of Madness
Tenth graders organize and interpret data from a student health program. In this physical education lesson, 10th graders use a body composition analyzer over 8 weeks to determine the validity of a student health program. ...
Curated OER
Spelling Activity: Suffixes
Understanding spelling patterns is a vital tool. Suffixes ful, ness, ment, and ly are examined in this spelling patterns activity. The class determines how to use each suffix to change the meaning of a set of given root words.
Curated OER
Cruising the Internet
Students identify the parts of an engine using a graph. In this statistics lesson, students make a graph from their collected data. They calculate the volume of a cylinder using a line of regression and a scatter plot.
Curated OER
Equation of a Line
In this equation of a line worksheet, 9th graders solve and complete 4 different multiple choice problems. First, they use the median fit method to determine the equation that most likely represents the line of best fit for the data...
Curated OER
Get a Half Life!
Eighth graders use M&M's to experiment with data. They use a graphing calculator to determine the best equation for their data; linear, quadratic or exponential. They analyze the data to find the half-life of their M&M's.
Curated OER
Linear Systems: Least Squares Approximations
In this least squares approximation instructional activity, students determine the number of solutions a given linear system has. They find the least square error and the equation of a line of best fit for a set of three points. Students...
Curated OER
Data Analysis
In this data analysis activity, 8th graders solve and complete 4 different problems that include determining the line of best fit for each. First, they write the prediction for an equation for each situation described. Then, students...
Curated OER
Quantitative Determination of the Composition of Water-based Paints and the Correlation of Paint Properties to Pain Composition
Students perform a series of tests on water-based paints. In this chemistry lesson, students identify their different functions. They calculate paint density and fractional concentrations.
Curated OER
Balsa Wood Airplane Flight and Speed Correlation
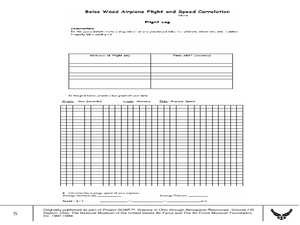
Ninth graders calculate the average speed of their balsa wood airplane. In this physics activity, 9th graders build their own airplane and make necessary modifications to to make it fly straight. They interpret distance and time graph...
EngageNY
Mid-Module Assessment Task: Grade 8 Module 6
Make sure pupils have the skills to move on to the second half of the module with a mid-module assessment task. The formative assessment instrument checks student learning before moving on to the rest of the lessons in the unit.
Teach Engineering
Statistical Analysis of Flexible Circuits
Scholars connect statistical analysis with flexible electric circuits. They first learn about flexible circuits and their applications through a PowerPoint presentation and then consider how the fabrication process for these circuits...
Math Moves U
Collecting and Working with Data
Add to your collection of math resources with this extensive series of data analysis worksheets. Whether your teaching how to use frequency tables and tally charts to collect and organize data, or introducing young...
Curated OER
Line of Best Fit
In this line of best fit instructional activity, students solve and complete 8 different problems that include plotting and creating their own lines of best fit on a graph. First, they study the samples at the top and plot the ordered...
American Statistical Association
You and Michael
Investigate the relationship between height and arm span. Young statisticians measure the heights and arm spans of each class member and create a scatter plot using the data. They draw a line of best fit and use its slope to explain the...


