EngageNY
Methods for Selecting a Random Sample
Random sampling is as easy as choosing numbers. Teams use random numbers to create a sample of book lengths from a population of 150 books. The groups continue by developing a technique to create samples to compare from two populations...
Virginia Department of Education
Translate and Evaluate
Translate, evaluate, educate. Discover how to translate and evaluate expressions. Young mathematicians first review words and phrases that indicate operations and learn to write algebraic expressions from verbal descriptions....
Federal Reserve Bank
Credit Reports—and You Thought Your Report Card Was Important
Get the facts about credit and take a close look at what factors into a consumer credit report with this fantastic lesson. Your pupils will read informational texts, read sample financial documents, and discuss the advantages and...
Curated OER
Investigation Designing a Patchwork Quilt
Fourth graders practice calculating area by creating a classroom quilt. Students are given a 6x6 inch square material they design based on a classroom theme. A sample of the class quilt is created using graph paper so students may...
Visa
A Perfect Fit: Finding the Right Career for You
Class members explore possible career paths and consider their own passions and interests by researching job openings, career descriptions, and skills, as well as reading the success stories of experienced entrepreneurs.
Curated OER
M & M Madness
M&M's are always a great manipulative to use when teaching math. In this graphing lesson plan, learners predict how many of each color of M & M's there are. They count up each color and plug the data into a graph using the...
Ohio Department of Education
I Can Do This! Systems of Equations
Use tables, graphs, and substitution to solve systems of linear equations. An envelope of sample problems is passed around the classroom, and each learner has the opportunity to solve the system in the envelope. This is a great way to...
Mathematics Assessment Project
Building and Solving Linear Equations
Young scholars write and solve linear equations in one variable based on descriptions of the operations that are applied to the unknown variable in an algebra machine. They then create their own problems for classmates to solve.
Curated OER
Statistical Sampling
Students collect data in the field and analyze it in class using tables and graphs to determine how many observations of a phenomenon are necessary to draw valid conclusions.
Curated OER
Great Graphing
Students collect data, use a computer spreadsheet program to create various graphs, and compare the graphs. They state the findings of each graph in writing and decide which graph type best represents the data.
Curated OER
Money Math: Lessons for Life
Students develop a budget for a college student using all of the influences that the student would have. In this budgeting lesson plan, students use real life examples to create a budget spreadsheet. Students read and study sample...
Curated OER
Geo Jammin' By DeSign - Day 5, Lesson 25: Geo Jungle
Students search the school grounds for examples of symmetry in nature. They bring examples back to the classroom and write about them.
Curated OER
Using A Checkbook
Students discover how to correctly write a check, fill out a deposit slip, and use a check register. They explain the concept of balancing a checkbook. After a lecture/demo, students use handouts imbedded in this plan to practice using...
Curated OER
M & M Madness
Second graders graph M & M's by color. For this graphing lesson plan, 2nd graders first predict how many of each color they think are in a handful of M & M's. Then they graph the amounts of each color on a computer program....
Curated OER
Jellybean Graphs
Second graders predict and graph data based on the color of jelly beans they think are in a handful. In this prediction lesson plan, 2nd graders will predict how many of each color jellybean are in a handful. Then they graph these...
Curated OER
Spreadsheet Activity
Learners create a spreadsheet to match a given sample. This includes adjusting column width and row height, changing alignment, changing size and style of print, changing number format.
Curated OER
"If You Hopped Like a Frog" by David M. Schwartz
Middle schoolers brainstorm several animal/personal scenarios, select one, and write out an explanation of the comparison. They apply the measurements/characteristics to themselves and use algebraic equations to demonstrate the comparison.
Curated OER
Creating Bar Graphs
Fifth graders design and label a bar graph using data taken from a class survey. They observe a teacher-led lecture, write and conduct their survey, and create a bar graph that includes identification of the minimum, maximum, mode,...
Curated OER
Data Analysis and Probability: Graphing Candy with Excel
Collect and graph data using Microsoft Excel with your math class. They will make predictions about the number of each colored candy in a bag of M&M's, then sort, classify, count, and record the actual data before using Excel to...
Curated OER
Gold Rush California and its Diverse Population
Students compare contemporary cultural differences with historical differences based on population percentage. In this cross-curriculum Gold Rush/math lesson, students analyze aspects of California's Gold Rush population and diversity...
Virginia Department of Education
Analyzing and Interpreting Statistics
Use measures of variance to compare and analyze data sets. Pupils match histograms of data sets to their respective statistical measures. They then use calculated statistics to further analyze groups of data and use the results to make...
Tech4Learning
Fantastic Fractions
Learners study how shapes can be divided into equal parts, that each part be equal to its counterpart, and combining parts equals one whole. They make the shapes out of modeling clay and take digital pictures of its parts to create an...
Curated OER
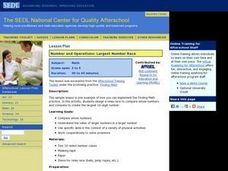
Number and Operations- Largest Number Race
Students participate in a race to compare whole numbers. In this number operations activity, students create the largest 10-digit number and discuss how they constructed the largest number.
Curated OER
Accounting/ Marketing Cookies
Second graders become involved in the advertisement, marketing, and development of their own cookie business. Students must choose a job for the preparation and baking of the cookies. Students also manage the profits and advertisement of...


