EngageNY
Exploring the Symmetry in Graphs of Quadratic Functions
Math is all about finding solutions and connections you didn't expect! Young mathematicians often first discover nonlinear patterns when graphing quadratic functions. The lesson plan begins with the vocabulary of a quadratic graph and...
EngageNY
The Graph of a Linear Equation in Two Variables Is a Line
Show your class that linear equations produce graphs of lines. The 20th segment in a unit of 33 provides proof that the graph of a two-variable linear equation is a line. Scholars graph linear equations using two points, either from...
EngageNY
Every Line is a Graph of a Linear Equation
Challenge the class to determine the equation of a line. The 21st part in a 33-part series begins with a proof that every line is a graph of a linear equation. Pupils use that information to find the slope-intercept form of the equation...
EngageNY
Graphing Factored Polynomials
Young mathematicians graph polynomials using the factored form. As they apply all positive leading coefficients, pupils demonstrate the relationship between the factors and the zeros of the graph.
EngageNY
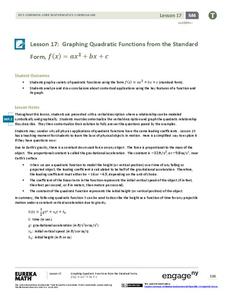
Graphing Quadratic Functions from the Standard Form
Use context to explain the importance of the key features of a graph. When context is introduced, the domain and range have meaning, which enhances understanding. Pupils use application questions to explore the key features of the graph...
CK-12 Foundation
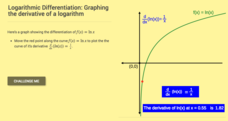
Logarithmic Differentiation: Graphing the Derivative of a Logarithm
Log the values of the derivative of a logarithm. The interactive plots the derivative of the natural logarithm. Learners first determine the derivative of natural logarithm and the general logarithm. Using the formulas for the...
EngageNY
Interpreting Quadratic Functions from Graphs and Tables
Seeing functions in nature is a beautiful part of mathematics by analyzing the motion of a dolphin over time. Then take a look at the value of a stock and maximize the profit of a new toy. Explore the application of quadratics by...
EngageNY
Graphs of Quadratic Functions
How high is too high for a belly flop? Learners analyze data to model the world record belly flop using a quadratic equation. They create a graph and analyze the key features and apply them to the context of the video.
Curated OER
Worksheet 24 - Derivative
In this derivative worksheet, students identify second derivatives and find the directional derivative of a function. They also list the extremes and saddle points of a function. This one-page worksheet contains seven multi-step problems.
Curated OER
Worksheet 23 - Directional Derivative
In this function worksheet, students compute the directional derivative of a function and identify the xy-coordinates of the maximum and local minimum. This two page worksheet contains six multi-step problems.
Kenan Fellows
Man vs. Beast: Approximating Derivatives using Human and Animal Movement
What does dropping a ball look like as a graph? An engaging activity asks learners to record a video of dropping a ball and uploading the video to software for analysis. They compare the position of the ball to time and calculate the...
EngageNY
The Line Joining Two Distinct Points of the Graph y=mx+b Has Slope m
Investigate the relationship between the slope-intercept form and the slope of the graph. The lesson plan leads an investigation of the slope-intercept equation of a line and its slope. Pupils realize the slope is the same as the...
West Contra Costa Unified School District
Derivative – Standard Definition
Making a clear connection to algebra concepts helps learners understand the definition of a derivative. The lesson begins with looking at limits of simple linear and rational functions, and leads to the definition of the derivative....
EngageNY
The Graph of the Natural Logarithm Function
If two is company and three's a crowd, then what's e? Scholars observe how changes in the base affect the graph of a logarithmic function. They then graph the natural logarithm function and learn that all logarithmic functions can be...
EngageNY
Writing and Graphing Inequalities in Real-World Problems
Inequalities: when one solution just doesn't suffice. Individuals learn to write inequalities in real-world contexts and graph solution sets on the number line. All inequalities in the instructional activity are of the form x < c or x...
EngageNY
Graphs of Functions and Equations
Explore the graphs of functions and equations with a resource that teaches scholars how to graph functions as a set of input-output points. They learn how the graph of a function is the graph of its associated equation.
EngageNY
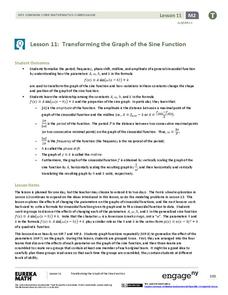
Transforming the Graph of the Sine Function
Build a solid understanding of trigonometric transformations through exploration. Learners work in teams to analyze the effects of different algebraic components on the graph of a sine function.
EngageNY
Some Facts About Graphs of Linear Equations in Two Variables
Develop another way to find the equation of a line. The lesson introduces the procedure to find the equation of a line given two points on the line. Pupils determine the two points from the graph of the line.
EngageNY
Basic Trigonometric Identities from Graphs
Have young mathematicians create new identities! They explore the even/odd, cofunction, and periodicity identities through an analysis of tables and graph. Next, learners discover the relationships while strengthening their understanding...
Curated OER
Graphing of Functions Using First and Second Derivatives
In this calculus worksheet, students solve problems using the first and second derivatives. They define the behavior of the function based on the derivative. There are 11 questions with an answer key.
Curated OER
Derivatives
In this derivatives worksheet, students identify intervals. They differentiate given functions. This one page worksheet contains seven multi-step problems.
EngageNY
Analyzing a Graph
Collaborative groups utilize their knowledge of parent functions and transformations to determine the equations associated with graphs. The graph is then related to the scenario it represents.
EngageNY
Stretching and Shrinking Graphs of Functions
Why is that graph wider? Pupils learn about stretching and shrinking graphs of square root, absolute value, cubic, and quadratic functions. They study both vertical and horizontal stretches and shrinks in addition to reflections.
EngageNY
Interpreting the Graph of a Function
Groups sort through NASA data provided in a graphic to create a graph using uniform units and intervals. Individuals then make connections to the increasing, decreasing, and constant intervals of the graph and relate these connections...


