TED Talks
Ted: Ted Ed: What Causes Economic Bubbles?
During the 1600's, the exotic tulip became a nationwide sensation; some single bulbs even sold for ten times the yearly salary of a skilled craftsman. Suddenly, though, the demand completely plummeted, leaving the tulip market in a...
Khan Academy
Khan Academy: Law of Demand
If the price of something goes up, people are going to buy less of it.
University of Nebraska Omaha
Ec Ed Web: Analyzing the Demand Curve
Lists the determinants of demand for a product and service. The site is useful for students wishing to look further into the causes of demands. Graphs and summaries are included to aid research.
Texas Education Agency
Texas Gateway: Ch. 12: The Policy Implications of the Neoclassical Perspective
By the end of this section, you will be able to do the following: Discuss why and how inflation expectations are measured, Analyze the impacts of fiscal policy and monetary policy on aggregate supply and aggregate demand. Explain the...
Khan Academy
Khan Academy: Market Equilibrium
The actual price you see in the world is a balancing act between supply and demand.
Khan Academy
Khan Academy: Changes in Equilibrium Price and Quantity: The Four Step Process
Analyze some step-by-step examples of shifting supply and demand curves. This resource is designed for students who are taking a college-level microeconomics course.
Other
South Western Learning: Oligopoly/monopolistic Competition: Kinked Demand Curve
This South-Western College Publishing website describes a situation in which oligopolistic firms vie for competition among consumers.
Curated OER
Supply and Demand
This website offers a very simple yet helpful description and example of the interaction of supply and demand, and what will happen to price and quantity when one or both of your supply and demand curves shift. This would be a good place...
Curated OER
Supply and Demand
This website offers a very simple yet helpful description and example of the interaction of supply and demand, and what will happen to price and quantity when one or both of your supply and demand curves shift. This would be a good place...
Curated OER
Shifting a Curve
This site shows both a supply and demand schedule, and constructs a graph using this schedule. It continues on to discuss equilibrium, and then shows a new equilibrium after there has been a change in supply.
Texas Education Agency
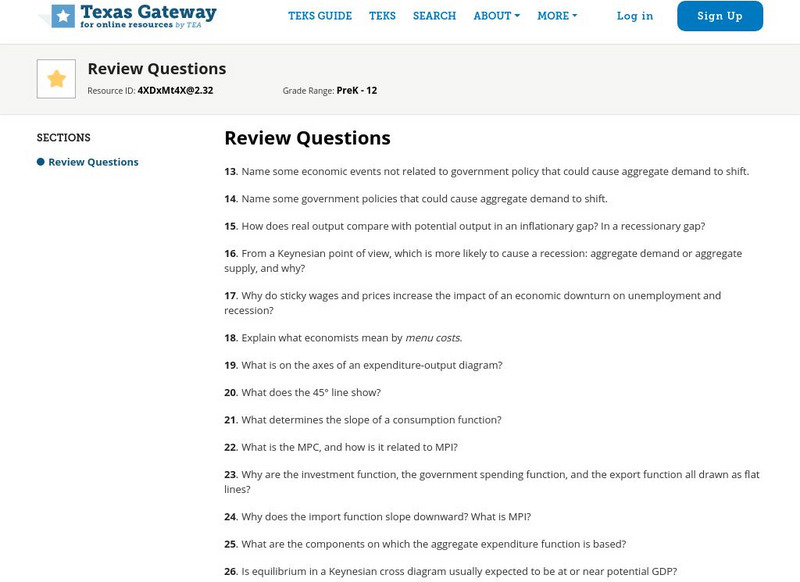
Texas Gateway: Chapter 11: The Keynesian Perspective: Review Questions
This section provides 23 review study questions to aid understanding of the content in Chapter 11: The Keynesian Perspective from the Texas Gateway AP Macroeconomics online text.
Curated OER
Graph of Supply and Demand Curves
This site shows both a supply and demand schedule, and constructs a graph using this schedule. It continues on to discuss equilibrium, and then shows a new equilibrium after there has been a change in supply.
Texas Education Agency
Texas Gateway: Chapter 4: Labor and Financial Markets: Review Questions
This is a list of eight review study questions covering the information in Chapter 4: Labor and Financial Markets.
Khan Academy
Khan Academy: Equilibrium in the Ad as Model
Practice what you've learned about modeling a short-run macroeconomic equilibrium in this exercise.
Curated OER
Official Paul Krugman Web Page: The Energy Crisis Revisited
Analysis of the energy crisis of the 70s. An oil chart to illustrate the supply and demand curve.
Curated OER
Official Paul Krugman Web Page: The Energy Crisis Revisited
Analysis of the energy crisis of the 70s. An oil chart to illustrate the supply and demand curve.
Other popular searches
- Supply and Demand Curve
- Supply and Demand Curves
- Supply & Demand Curves
- Supply Demand Curve
- Supply Demand Curves
- Supply \\& Demand Curves
- Supply \& Demand Curves


