Curated OER
Buying on Credit
Students determine how buying on credit adds to the total cost of an item by computing the interest. They find a major item advertised in a magazine and identify the price. Then they identify the rate of a credit card and calculate the...
Curated OER
Introducing Microsoft Word
Young scholars introduced to word processing by having them open a new document and use at least three to five commands within the program. Word processing commands are reinforced and practiced to gain more knowledge about entering and...
Curated OER
Managing Medical Conditions
Students investigate more about a medical condition that is of interest to them and write what they have learned about that condition, using the information as a personal resource or to share with others. They record information they...
Curated OER
Party Time
Students engage in a lesson about finding information from the grocery store to put into data that can be measured. The data is found in advertisements and food labels. They plan the cost of a party when using the unit cost of various...
Curated OER
EUREKA!
Students gather information and complete a personal medical history form. They use this to aid in future medical experiences that they may have in their field of study. .Students write their medical histories to prepare for interactions...
Curated OER
Picture This
Students create a descriptive paragraph conveying ideas utilizing a personal photograph as a prompt for their writing. This concept includes the writers emotions, personal issues, education, art and photography. They share insights to...
Curated OER
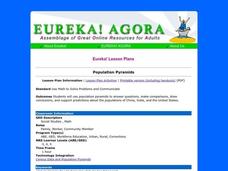
Population Pyramids
Students engage in a lesson that is about the concept of measuring the statistical data of a population taken from a census. The data is interpreted and recorded looking for trends in subjects like world economy and job opportunities.
Curated OER
Regions of the United States
Students present a travelogue, an alternate format to preparing their writing, of a specific U.S. geographic region that includes the aspects of population, climate, landforms, economics, culture, famous people and places and natural...
Curated OER
Scientific Method
Students conduct an experiment and complete a chart demonstrating some of the basic properties and components of water via the scientific method. They encompass strategies such as questioning, making predictions, comparing/contrasting...
Curated OER
The Vitruvian Theory - Does It Apply to You?
Students explore the concept of the Vitruvian theory. In this Vitruvian theory lesson, students collect data from their classmates about their arm span and height. Students compare their ratios of arm span to height...
Curated OER
Frieze Design in Indigenous Art
Students describe Frieze designs using the work of indigenous people. In this math instructional activity, students create 7 frieze designs using different patterns. They create one row of repeated art and repeat...
Curated OER
Important Decisions Don't Just Happen! Using Data to Plan Your Services
Students interpret statistics. In this data lesson, students examine and organize given data. They present the data in a grid format. Using the census data, students determine the best location for a local business.
Curated OER
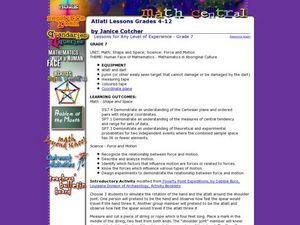
Atlatl Lessons for Grade 7
Seventh graders examine force and motion. In this seventh grade mathematics/science lesson plan, 7th graders collect and analyze data regarding the use of an atlatl to throw a spear. Students describe and analyze the motion which leads...
Curated OER
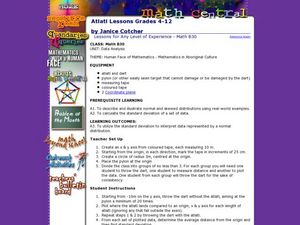
Human Face of Mathematics - Mathematics in Aboriginal Culture
Students collect statistical data. In groups, students play a dart game and then determine the distance between darts. They collect the data and plot the information on a coordinate plane. They identify the mean and the...
Curated OER
Atlatl Lessons Grades 4-12: Lesson for Beginning Users of Atlatl
Sixth graders determine the mean, range median and mode of a set of numbers and display them. In this data instructional activity students form a set of data and use computer spreadsheet to display the information. They extend of...
Curated OER
Lessons for Beginner Atlatl Users
Ninth graders research weapons of the Aboriginal people and throw a dart with and without the use of an atlatl. For this cross curricular lesson, 9th graders research the weapons of the Aboriginal people. They throw darts with and...
Curated OER
Lessons for Atlatl Users with Some Experience-Grade 5
Fifth graders throw darts, collecting data for distance traveled. In this data analysis instructional activity, 5th graders throw a dart using an atlatl. They calculate the speed for each throw and determine the best dart length for...
Curated OER
Lessons for Atlatl Users with Some Experience-Grade 6
Sixth graders experiment with an atlatl and dart. In this sixth grade data management mathematics lesson plan, 6th graders explore and determine the most suitable methods of displaying data collected from their experimentation with...
Curated OER
Pumped Up Gas Prices
Learners calculate gas prices. In this transportation instructional activity, students tally the mileage and gas costs of their car for one months. They figure out how much was spent on gas and create a graph showing average gas prices...
Curated OER
Book Report Activity
Middle schoolers analyze language arts by reading a book in class. In this book report lesson, students must read one of five selected books including 1984 and Lord of the Flies. Middle schoolers prepare a two page report and create a...
Ohio Literacy Resource Center
Regions of the United States
Young scholars create a travelogue of a particular U.S geographic region that includes aspects of population, climate, landforms, culture, famous people, and places as well as any natural resources. They present the travelogue to the class.
Curated OER
A Rose Is a Rose
Flowering learners explore the concept of figurative language as it relates to poems, songs, or creative written expression. In this creative writing lesson plan, they complete several phrases using similes, metaphors, and...
Curated OER
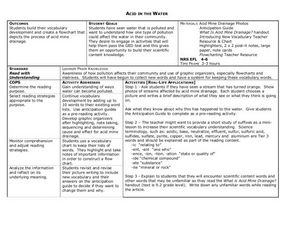
Acid in the Water
Ninth graders learn about the effect pollution has on water and how this affects their community. In this environmental awareness instructional activity, 9th graders expand their vocabulary and create a flowchart that...
Curated OER
Build A Skittles Graph
Students explore graphing. In this graphing lesson, students sort Skittles candies and use the color groups to create a bar graph. Rubrics and extension activities are provided.
Other popular searches
- Create a Database
- Database Programs
- Database Search
- Databases. Search Engines
- Database Research
- Access Databases
- Class Database
- Student Book Database
- Relational Database
- Database Computer Programs
- Database Lesson Plans
- Book Database


