Next Gen Personal Finance
Next Gen Personal Finance: Taxes Data Crunch
Data Crunches feature one chart or graph followed by five scaffolded questions to guide students through analyzing the data and drawing conclusions. These sets of data help students understand tax concepts.
Next Gen Personal Finance
Next Gen Personal Finance: Financial Pitfalls Data Crunch
Data Crunches feature one chart or graph followed by five scaffolded questions to guide students through analyzing the data and drawing conclusions. These sets of data help students understand financial concepts.
Next Gen Personal Finance
Next Gen Personal Finance: Budgeting Data Crunch
Data Crunches feature one chart or graph followed by five scaffolded questions to guide students through analyzing the data and drawing conclusions. These sets of data help students understand financial concepts such as budgeting.
Next Gen Personal Finance
Next Gen Personal Finance: Paying for College Data Crunch
Data Crunches feature one chart or graph followed by five scaffolded questions to guide students through analyzing the data and drawing conclusions. These pertain to paying for college.
CK-12 Foundation
Ck 12: Statistics: Displaying by Type of Data Grade 8
[Free Registration/Login may be required to access all resource tools.] Create and use different data displays to analyze and draw conclusions about different sets of data.
Texas Instruments
Texas Instruments: Data Analysis
Students learn to design data investigations, describe data, and draw conclusions. They learn to choose the best type of graph, graph and interpret the data, and look for patterns and trends. They also use the calculator to investigate...
Google
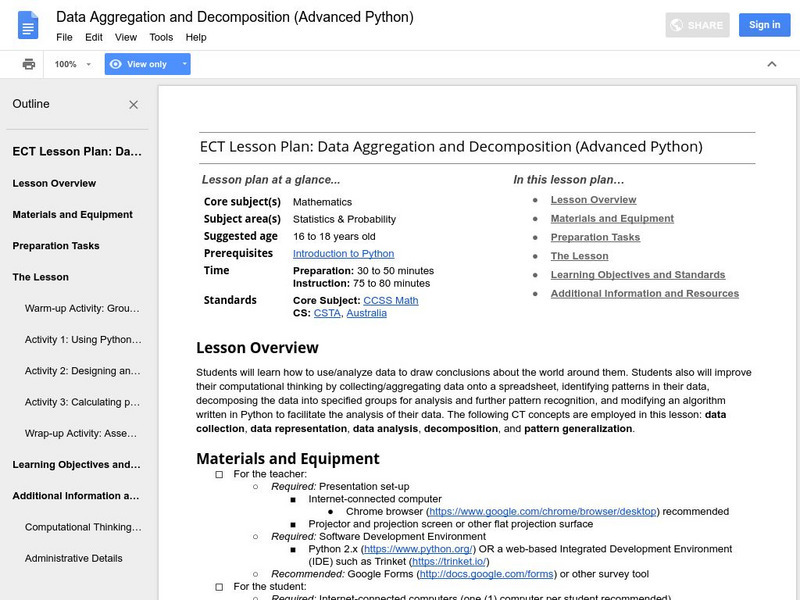
Google for Education: Data Aggregation and Decomposition (Python)
Students learn how to use and analyze data to draw conclusions about information collected from classmates. Then they use computational thinking by collecting and aggregating data onto a spreadsheet, identifying patterns in their data,...
Science Education Resource Center at Carleton College
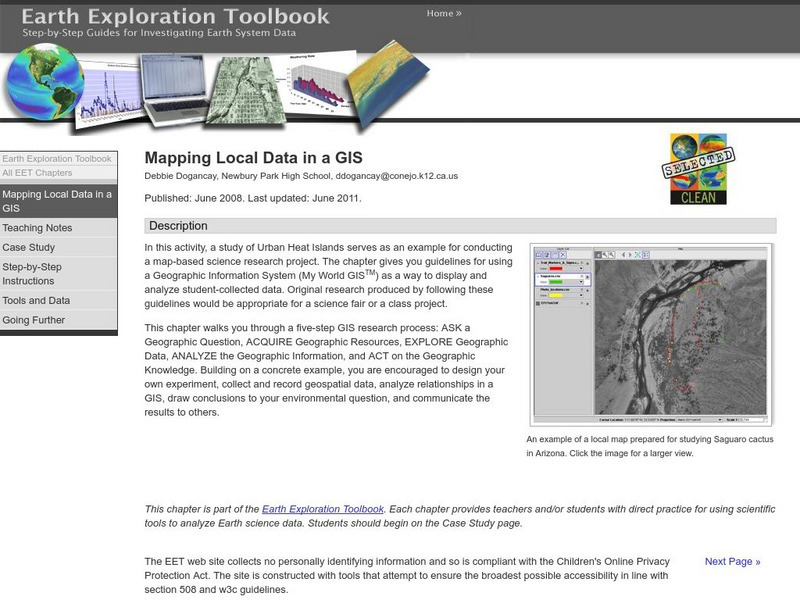
Serc: Mapping Local Data in a Gis
In this activity, students will learn how to conduct a map-based science research project using a Geographic Information System (GIS). They will design an experiment, collect and record geospatial data, analyze geospatial relationships...
ClassFlow
Class Flow: Cumulative Frequency Data Handling
[Free Registration/Login Required] Students draw conclusions and engage in tables and charts involving cumulative frequency; a wonderful review of student's knowledge.
City University of New York
Scientific Method and Probability: Interactive Activity
This interactive lesson begins with the basics and carries through to methods of data analysis, all interactively. Supporting material is excellent.
Google
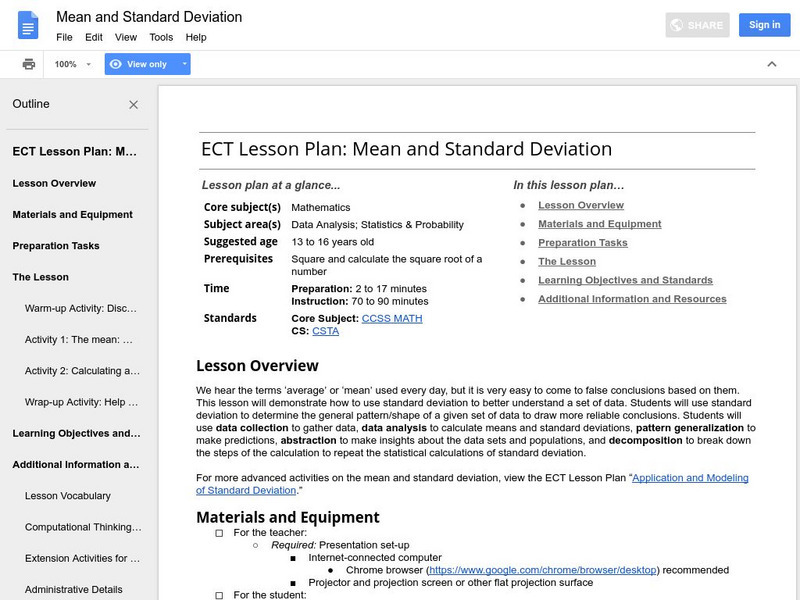
Google for Education: Mean and Standard Deviation
This instructional activity demonstrates to students how to use standard deviation to better understand a set of data. Students use standard deviation to determine the general pattern or shape of a given set of data to draw more reliable...
Texas Instruments
Texas Instruments: Collecting Data in Geometry
This activity is designed for students to make conjectures about triangles. Students will create three lists to represent the measures of the angles of the triangle. The entire class list will then be sent to each student for analysis,...
BioEd Online
Bio Ed Online: Balloon Blast
In the following lesson students are asked to devise a plan to measure the distance of a balloon's flight, predict the direction a balloon will travel as it deflates, learn about Newton's Laws of Motion, experience Newton's Third Law,...
Center for Innovation in Engineering and Science Education, Stevens Institute of Technology
Ciese: Down the Drain Project
Teachers can start this project at any time and no registration is required. Students collect data about water usage for themselves, their homes and their class. They analyze it, make predictions about it, and submit the data to the...
Texas Instruments
Texas Instruments: Gemini Candy
In this activity, students work in groups to collect data and draw conclusions from random samples simulated by drawing tiles from a bag. They represent the data collected in the form of a triple bar graph.
Other
Science Fair Primer: Reporting the Results
A good explanation of the elements of a good science fair report written by a high school science teacher. Details are given step by step on stating the hypothesis, explaining the experimental procedure, presenting the data attained, and...
University of Washington
Washington U: Model for Conducting Scientific Research
This page outlines the scientific method, step by step.
Texas Education Agency
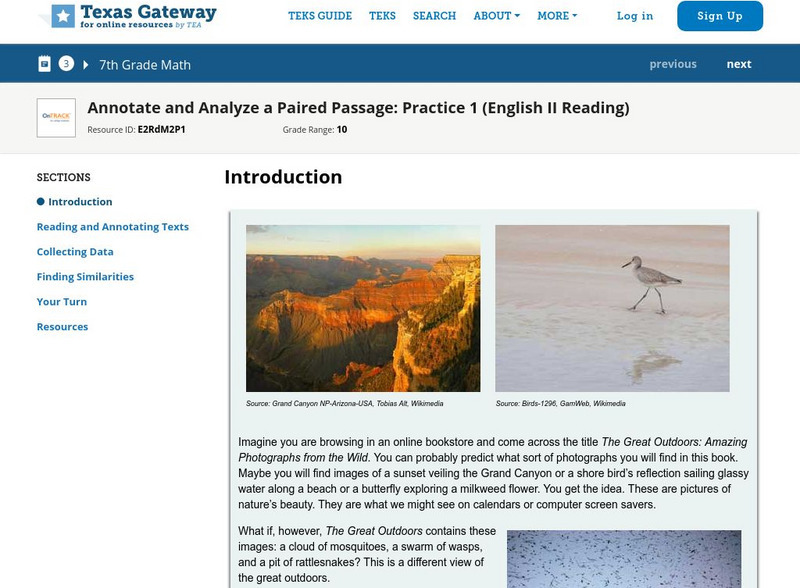
Texas Gateway: Annotate and Analyze a Paired Passage: Practice 1
In this lesson, you will read and annotate a pair of texts to make inferences, draw conclusions, and synthesize ideas and details using textual evidence. Prepare to get involved in a conversation between you and the two texts you will be...
Songs for Teaching
Songs for Teaching: Scientific Method Blues
This lesson introduces the scientific method to your young scholars through song. Students will learn the steps of the scientific method through this great song written by Kathleen Carroll. Click on the link and play it for your whole...
Science Education Resource Center at Carleton College
Serc: Investigating the Magnetic Force Field: Calculating Magnetic Pull
In this classroom activity, the students will investigate the magnetic pull of a bar magnet at varying distances with the use of paper clips. Students will hypothesize, conduct the experiment, collect the data, and draw conclusions that...
Scholastic
Scholastic: Dirtmeister's Science Lab: Let the Sun Shine In
Students graph data reflecting time of day and length of shadow, and then draw conclusions about Earth's seasons and position in relation to the Sun.
TeachEngineering
Teach Engineering: Wild Wind
Students will learn the difference between global, prevailing and local winds. In this activity, students will make a wind vane out of paper, a straw and a soda bottle and use it to measure wind direction over time. Finally, they will...
Other
The Habitable Planet Simulation
This activity is designed to accompany an interactive on the Annenberg Learner website. Students investigate the changes that take place in an ecosystem when they alter the organisms in a food web. As they work with the simulation, they...
Other
Honolulu Community College: Galileo's Kinematics
In this experiment you will attempt to reproduce Galileo's results using the inclined plane. You will test three hypotheses relating to motion on an incline. You will learn to draw a "best fit" or regression line of experimental data....


