CK-12 Foundation
Ck 12: Statistics: Displaying by Type of Data Grade 8
[Free Registration/Login may be required to access all resource tools.] Create and use different data displays to analyze and draw conclusions about different sets of data.
Texas Instruments
Texas Instruments: Data Analysis
Students learn to design data investigations, describe data, and draw conclusions. They learn to choose the best type of graph, graph and interpret the data, and look for patterns and trends. They also use the calculator to investigate...
Google
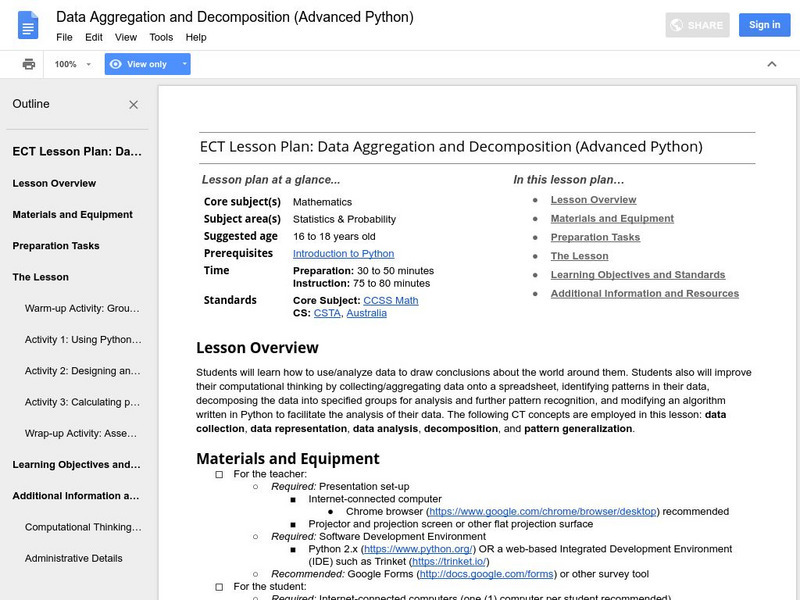
Google for Education: Data Aggregation and Decomposition (Python)
Students learn how to use and analyze data to draw conclusions about information collected from classmates. Then they use computational thinking by collecting and aggregating data onto a spreadsheet, identifying patterns in their data,...
Science Education Resource Center at Carleton College
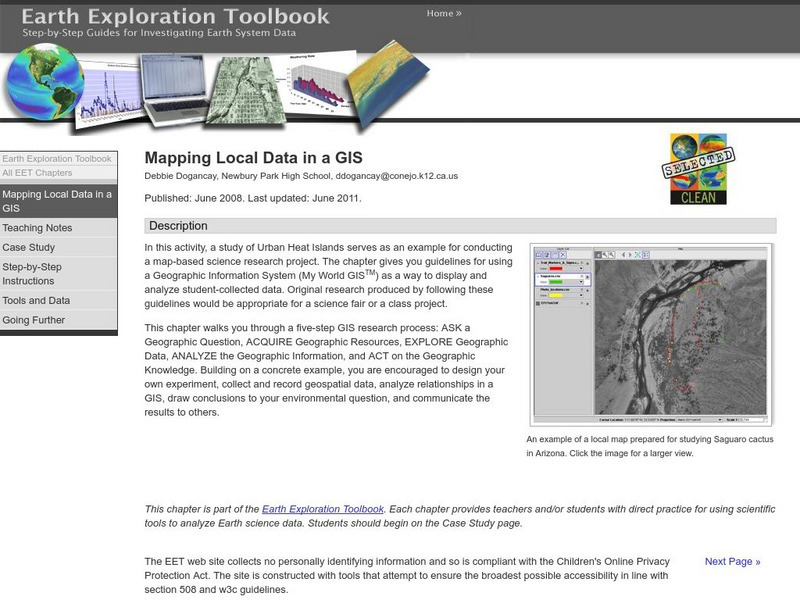
Serc: Mapping Local Data in a Gis
In this activity, students will learn how to conduct a map-based science research project using a Geographic Information System (GIS). They will design an experiment, collect and record geospatial data, analyze geospatial relationships...
ClassFlow
Class Flow: Cumulative Frequency Data Handling
[Free Registration/Login Required] Students draw conclusions and engage in tables and charts involving cumulative frequency; a wonderful review of student's knowledge.
City University of New York
Scientific Method and Probability: Interactive Activity
This interactive lesson begins with the basics and carries through to methods of data analysis, all interactively. Supporting material is excellent.
Google
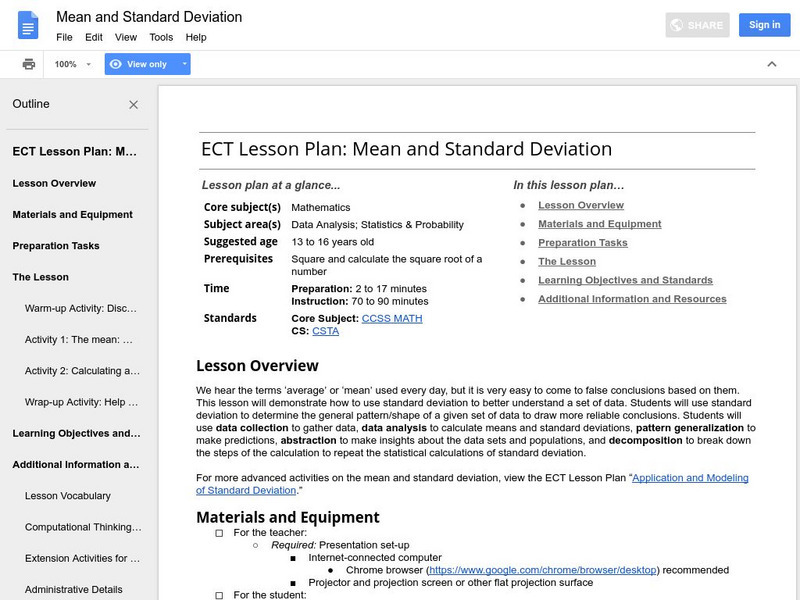
Google for Education: Mean and Standard Deviation
This lesson demonstrates to students how to use standard deviation to better understand a set of data. Students use standard deviation to determine the general pattern or shape of a given set of data to draw more reliable conclusions.
Texas Instruments
Texas Instruments: Collecting Data in Geometry
This activity is designed for students to make conjectures about triangles. Students will create three lists to represent the measures of the angles of the triangle. The entire class list will then be sent to each student for analysis,...
Center for Innovation in Engineering and Science Education, Stevens Institute of Technology
Ciese: Down the Drain Project
Teachers can start this project at any time and no registration is required. Students collect data about water usage for themselves, their homes and their class. They analyze it, make predictions about it, and submit the data to the...
Texas Instruments
Texas Instruments: Gemini Candy
In this activity, students work in groups to collect data and draw conclusions from random samples simulated by drawing tiles from a bag. They represent the data collected in the form of a triple bar graph.
University of Washington
Washington U: Model for Conducting Scientific Research
This page outlines the scientific method, step by step.
Texas Education Agency
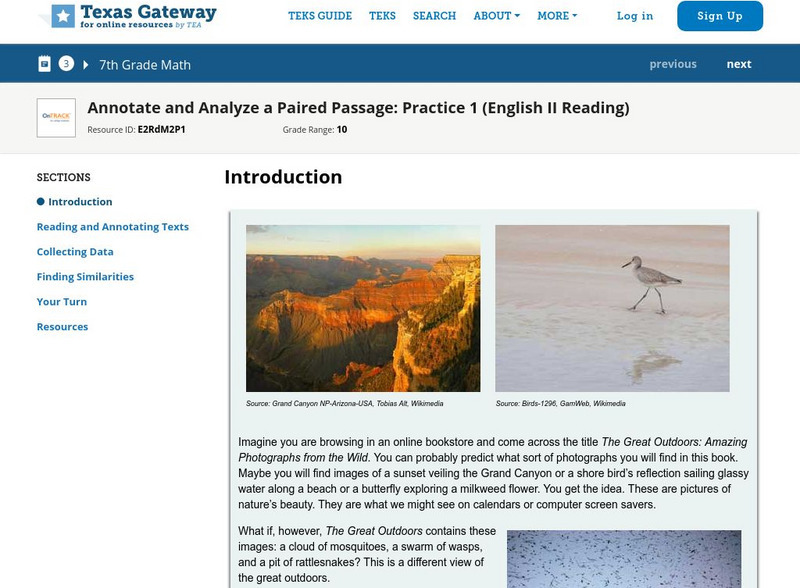
Texas Gateway: Annotate and Analyze a Paired Passage: Practice 1
In this lesson, you will read and annotate a pair of texts to make inferences, draw conclusions, and synthesize ideas and details using textual evidence. Prepare to get involved in a conversation between you and the two texts you will be...
Songs for Teaching
Songs for Teaching: Scientific Method Blues
This lesson introduces the scientific method to your students through song. Students will learn the steps of the scientific method through this great song written by Kathleen Carroll. Click on the link and play it for your whole class.
Science Education Resource Center at Carleton College
Serc: Investigating the Magnetic Force Field: Calculating Magnetic Pull
In this classroom activity, the students will investigate the magnetic pull of a bar magnet at varying distances with the use of paper clips. Students will hypothesize, conduct the experiment, collect the data, and draw conclusions that...
Scholastic
Scholastic: Dirtmeister's Science Lab: Let the Sun Shine In
Students graph data reflecting time of day and length of shadow, and then draw conclusions about Earth's seasons and position in relation to the Sun.
Louisiana Department of Education
Louisiana Doe: Louisiana Believes: English Language Arts: Grade 6: If Stones Could Speak
Sixth graders will explore history and will learn that archaeologists, like detectives, work to piece together the past through investigation. Archaeological research provides us with stories of human history that help us understand the...
Texas Instruments
Texas Instruments: Is There a Limit?
In this activity, students examine data about bacteria and their growth. They produce a scatter plot, a best-fit model, and draw conclusions based on the data and graph.
Science Education Resource Center at Carleton College
Serc: How Wind Affects Various Objects
In this activity, students experiment with various objects in a wind tunnel. Together, they record predictions and data in a class data table. Students will then use the information gained in the experiment to draw conclusions about the...
PBS
Pbs: The Roman Empire of the 1st Century: Mapping an Empire
In this lesson, students will compare a map of the Roman Empire in 44 BC with one of the Roman Empire in 116 AD. Using these two maps as a reference, students will use critical reading skills to learn about the expansion of the Roman...
Texas Instruments
Texas Instruments: Variety Is the Spice of Life
In this activity, students will collect data on all members of the class. They will make a graph of the data collected, interpret variations, and then draw conclusions.
Science Education Resource Center at Carleton College
Serc: Investigating Factors Influencing Rates of Chemical Reactions
This lab investigates the factors that influence rates of reactions. Students will develop a hypothesis, test the hypothesis, collect data, then draw a conclusion based on the data.
Science Education Resource Center at Carleton College
Serc: Newton's Second Law: Constant Force Applied to a Skateboarder
In this lab activity, students will become familiar with Newton's 2nd Law of Motion. By investigating the motion of different skateboarders pulled with a variety of constant force values, they will discover that bodies acted on by a...
Cynthia J. O'Hora
Mrs. O's House: Develop a Bird Feeder Watch List
Students will develop a list of local birds they might see at their home bird feeder. Once the list is compiled, observations of the birds will occur. Students will draw conclusions based on the data collected and report it to the class.
Science Education Resource Center at Carleton College
Serc: Resource Usage Project and Journal
Learners pick a resource and track their use of it over the course of one week. Students record their data in a spreadsheet, write a summary of it, and draw conclusions from their usage patterns. A detailed student handout is provided.


