Centre for Innovation in Mathematics Teaching
Ten Data Analysis Activities
This thirteen page data analysis worksheet contains a number of interesting problems regarding statistics. The activities cover the concepts of average measurements, standard deviation, box and whisker plots, quartiles, frequency...
Radford University
Data Analysis Activity
What do classmates think? In groups, learners design surveys to investigate chosen topics. They conduct the survey, then analyze the results. As part of the activity, they must calculate the mean, median, mode, variance, and standard...
Curated OER
Making Predictions from Data with a Graphing Calculator
In this making predictions from data activity, students solve 15 short answer problems. Students determine average miles per gallon given data on miles traveled and gas used. Students make predictions using the data and a line of best fit.
Curated OER
Describing Data
Your learners will practice many ways of describing data using coordinate algebra in this unit written to address many Common Core State Standards. Simple examples of different ways to organize data are shared and then practice problems...
Mathed Up!
Frequency Tables
The section of a larger General Certificate of Secondary Education math review requires pupils to summarize numerical data presented in a frequency table. Scholars determine the number of data points, the range, the mean, and the...
EngageNY
Calculating Probabilities of Events Using Two-Way Tables
Tables are useful for more than just eating. Learners use tables to organize data and calculate probabilities and conditional probabilities.
EngageNY
Calculating Conditional Probabilities and Evaluating Independence Using Two-Way Tables (part 1)
Being a statistician means never having to say you're certain! Learners develop two-way frequency tables and calculate conditional and independent probabilities. They understand probability as a method of making a prediction.
EngageNY
Using Sample Data to Estimate a Population Characteristic
How many of the pupils at your school think selling soda would be a good idea? Show learners how to develop a study to answer questions like these! The lesson explores the meaning of a population versus a sample and how to interpret the...
Curated OER
Graphs and Data
Pupils investigate poverty using graphs. In this algebra lesson, students collect data on the effects of poverty and use different rules to analyze the data. They graph and use the trapezoid rule to interpret the data.
EngageNY
Calculating Conditional Probabilities and Evaluating Independence Using Two-Way Tables (part 2)
Without data, all you are is another person with an opinion. Show learners the power of statistics and probability in making conclusions and predictions. Using two-way frequency tables, learners determine independence by analyzing...
EngageNY
Using a Curve to Model a Data Distribution
Show scholars the importance of recognizing a normal curve within a set of data. Learners analyze normal curves and calculate mean and standard deviation.
Inside Mathematics
Conference Tables
Pupils analyze a pattern of conference tables to determine the number of tables needed and the number of people that can be seated for a given size. Individuals develop general formulas for the two growing number patterns and use them to...
College Board
Reasoning from Tabular Data
Don't table the resource—use it now. An AP® Calculus curriculum module encourages the use of tabular data throughout the course. It provides some example topics, such as rate of change, net change, and average value of a function, where...
Willow Tree
Scatterplots and Stem-and-Leaf Plots
Is there a correlation between the number of cats you own and your age? Use a scatter plot to analyze these correlation questions. Learners plot data and look for positive, negative, or no correlation, then create stem-and-leaf plots to...
Curated OER
Analyzing Data Sets
In this analyzing data sets worksheet, 11th graders solve and complete 35 various types of problems that include the analysis of data given. First, they determine the equation that best describes the data shown in a table. Then, students...
Curated OER
Weather, Data, Graphs and Maps
Students collect data on the weather, graph and analyze it. In this algebra lesson, students interpret maps and are able to better plan their days based on the weather reading. They make predictions based on the type of clouds they see.
CCSS Math Activities
Social Security Trust Fund
Will Social Security still be around when you retire? Given data on the predicted balance of the social security fund over time, scholars plot the points on a coordinate grid and determine if a quadratic regression fits the data. They...
Mathematics Vision Project
Module 9: Statistics
All disciplines use data! A seven-lesson unit teaches learners the basics of analyzing all types of data. The unit begins with a study of the shape of data displays and the analysis of a normal distribution. Later lessons discuss the...
Radford University
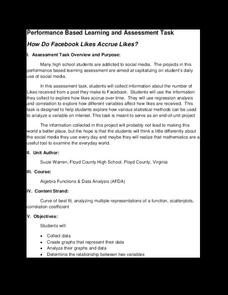
How Do Facebook Likes Accrue Likes?
Finally, a project pupils will instantly like! Young mathematicians collect data on the number of likes they receive for a social media post over time. During the first part of the project, they determine a curve of best fit and...
Georgetown University
Cup-Activity: Writing Equations From Data
Determine how cup stacking relates to linear equations. Pupils stack cups and record the heights. Using the data collected, learners develop a linear equation that models the height. The scholars then interpret the slope and the...
Willow Tree
Histograms and Venn Diagrams
There are many different options for graphing data, which can be overwhelming even for experienced mathematcians. This time, the focus is on histograms and Venn diagrams that highlight the frequency of a range of data and overlap of...
Willow Tree
Circle Graphs
Pie isn't just for eating! Scholars learn to create pie charts and circle graphs to represent data. Given raw data, learners determine the percent of the whole for each category and then figure out the degree of the circle that percent...
Willow Tree
Bar Graphs
Circles, lines, dots, boxes: graphs come in all shapes in sizes. Scholars learn how to make a bar graph using univariate data. They also analyze data using those bar graphs.
EngageNY
Sampling Variability in the Sample Mean (part 2)
Reduce variability for more accurate statistics. Through simulation, learners examine sample data and calculate a sample mean. They understand that increasing the number of samples creates results that are more representative of the...
Other popular searches
- Creating Data Tables
- Science Data Tables
- Making Data Tables
- Organizing Data in Tables
- Data Tables and Graphing
- Graphs and Data Tables
- Data Tables and Charts
- Create Data Tables From Graphs
- Data Tables Lesson Plans
- Data Tables Surveys
- Pocket Data Tables
- Using Data Displays


