Curated OER
Counting Squares
For this counting squares worksheet, students solve 2 problems that include counting 2 different sets of squares. First, they draw a picture of four squares arranged in two rows of two. Then, students determine the total number of...
Curated OER
The Football and Braking Distance: Model Data with Quadratic Functions
Students engage in a lesson that is about the concept of data analysis with the use of quadratics. They use a Precalculus text in order to give guidance for independent practice and to serve as a source for the teacher to use. The data...
Curated OER
Statistical Analysis For Graphing Calculators
Students analyze date from the Chesapeake Bay. Using a graphing calculator, they enter the data, plot three temperatures, and create a Box and Whisker plot.
Virginia Department of Education
Growing Patterns and Sequences
Learners explore, discover, compare, and contrast arithmetic and geometric sequences in this collaborative, hands-on activity. They build and analyze growing patterns to distinguish which kind of sequence is represented by a set of data...
Mathematics Assessment Project
Patchwork
Sew up learning on writing rules for patterns with an assessment task that has pupils investigate the number of triangles needed for cushions of different sizes. They then use the data to generate a rule for a cushion of any size.
Curated OER
Venn Diagrams, Part 3
Can your first graders interpret Venn diagrams? Different sets of clues help pupils narrow down a specific number in different shapes. They determine odds and evens, greater than or less than, and what shape the number is in. A fun...
Freecloud Design
Mathmateer
Three, two, one...liftoff! Elevate math skills to new heights while having a blast. A great resource that combines entertainment and education for children of all ages.
California Education Partners
Least and Greatest
Squares can be magic. Pupils use their knowledge of addition of positive and negative rational numbers to create a 3 X 3 magic square where the sums are 1. Scholars create addition and multiplication expressions with a set of rational...
Statistics Education Web
NFL Quarterback Salaries
Use statistics to decide if NFL quarterbacks earn their salaries! Learners study correlation coefficients after using technology to calculate regression equations. Through the data, they learn the meaning of correlation and correlation...
Curated OER
The Golden Students
Scholars view the video, "Donald Duck in Mathmagic Land," and discuss examples in nature which have proportions of the golden ratio. They measure and record different body lengths from a worksheet and convert the ratios to equivalent...
Alabama Learning Exchange
How Old is Your Money?
Elementary learners explore coin mint dates. First, they listen to the book Alexander Who Used to be Rich Last Sunday by Judith Viorst. They then sort a collection of coins according to their mint date and put them in order from oldest...
Radford University
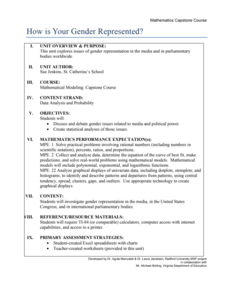
How Is Your Gender Represented?
Does the media shape people's views on gender? Scholars use data on gender portrayal in magazines to explore the idea. They use a spreadsheet program to create bar graphs and perform a chi-square test. They also use provided data to...
Curated OER
Diploid Genetics and Chromosomal Inheritance
Given the phenotypes of offspring in mice, flowers, and human blood type, genetics pupils practice determining the genotypes of the parents. Four short answer questions follow. The entire assignment will require learners to put on their...
Pingry School
Solubility Product of an Ionic Compound
How do scientists determine when a solution is fully saturated? Scholars address the topic as they observe patterns of precipitation in various concentrations of ions. Using a well plate, pipette, and common chemicals, they collect data...
Curated OER
Numbers and Operations as Words
Teach numbers in word form with this activity. In this numbers and operations worksheet, learners solve 22 problems in which numbers are written in word form. Learners solve the problems and write their responses in word form. Example:...
Heidi Songs
Zoo Animal Probability Graph
Capture the engagement of your young mathematicians with a collaborative graphing activity. Using a deck of zoo animal picture cards, students select a picture from the deck, record the chosen animal on a graph, and then replace the card...
Curated OER
Pair 'Em Up!
Third graders verify the validity of Punnett squares. They simulate a real-world situation by drawing chromosomes from a paper bag and track the data.
Curated OER
How Many More on a Graph?
First graders examine data on a graph and determine which variable on the graph has more. They draw pictures of their family members and determine which families have more members than other families. Using squares of paper to depict...
Curated OER
Numeric Response Problem
In this square units instructional activity, 3rd graders complete word problems about the amount of square units shown. Students complete 10 problems.
Curated OER
Favorite Sports Graph
In this data collection and graph worksheet, students ask each classmate which sport is their favorite based on the ones shown at the bottom of the graph. They color a square for each response, and tell the most and least popular sport.
Curated OER
What is Genetics?
In this biology worksheet, 9th graders identify which seed color is dominant in the given chart and explain why it is. Then they create a Punnett square showing the alleles of the parent plants and first generation of offspring.
Curated OER
Maps and Lines
In these organizing data worksheets, 5th graders complete four worksheets of activities that help them learn maps, graphs, and lines. Students then study images of maps, lines, and graphs.
Curated OER
Line and Double Line Graphs: Practice
In this graphing data worksheet, students use the double line graph to answer the five questions about high and low temperatures. Students then complete two test prep questions.
Curated OER
Pythagorean Theorem
In this measurement lesson, learners examine the Pythagorean Theorem, perimeter, and areas of right triangles. They record their measurements and research their findings on a grid.


