Curated OER
Representing Data
Second and third graders answer questions based on data presented to them in graphs. They see how to interpret data from a bar graph, line graph, and a chart.
Curated OER
Data Analysis: For Little Learners
Using pictographs, tally charts, and surveys, kids learn all about data analysis and collection. They make surveys, collect data, then construct pictographs and tally charts to organize their information.
Curated OER
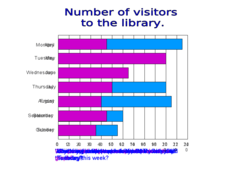
Bar Chart Questions
This resource includes two useful slides. Slide 1 is a bar chart that shows the number of people who went to the library in a weeks time, for discussion. Slide 2 includes a similar chart along side 10 data analysis questions for learners...
Curated OER
Graphing Toys!
Jason, Michelle, Sofia, and Willis all have a variety of toys. Use the chart provided to graph how many toys each child has. Who has the most toys? Who has the least? Help your learners study the graphs they create to better understand...
Curated OER
Pet Tally
Give the class an opportunity to practice using tally marks as a way to collect data. As you progress through the slide show, learners tally up the number and types of pets they see, they then use their data to create a tally chart....
EduGAINs
Data Management
Using a carousel activity, class members gain an understanding of the idea of inferences by using pictures then connecting them to mathematics. Groups discuss their individual problems prior to sharing them with the entire class. The...
Curated OER
Data Management and Probability: Applications
For this data management and probability applications worksheet, 8th graders solve 20 various types of probability problems. They find the mean, median, mode and range of various numbers. Then, students use the spinner illustration to...
Noyce Foundation
Ducklings
The class gets their mean and median all in a row with an assessment task that uses a population of ducklings to work with data displays and measures of central tendency. Pupils create a frequency chart and calculate the mean and median....
Curated OER
Survey Says...
Young statisticians collect, organize, and present data to illustrate responses to a survey question. They write and conduct the survey. They finish by presenting the results in the form of a graph.
Curated OER
Count the Images!
Based on a selection of images, learners create a bar graph depicting how many of each image is shown. There are two graphs, each with three images to chart. After they are finished, scholars can analyze the data and draw conclusions. To...
Curated OER
Graphing Our Marbles
Students collect information pertaining to marble colors found in their bag; then creating a spreadsheet in order to make a chart representing their findings using Microsoft Excel. Students will present their results to small groups.
Curated OER
Sweet Data
Students input data about the colors of their serving of M&M candies onto a spreadsheet. They create charts and graphs based on this information.
Curated OER
Holiday Greeting Cards: A Graphing Activity
Students examine statistics about the popular type of greeting cards and create pie or bar chart using an online tool. They illustrate the sales statistics for the greeting cards before making the charts.
Curated OER
Data With Candy
Students, while utilizing the classroom and the computer lab with a bag of colored candy, gather and interpret data, calculate averages and draw conclusions and draw a bar graph. They estimate how many candies are in the bag, what...
Curated OER
Graph Frenzy!!
Students brainstorm for a survey question to ask classmates. They survey their classmates. They enter the results into a spreadsheet and create the best graph for the information. They share their graphs with the class.
Curated OER
Graphing With Candy
Students gather information and interpret the results using a tally chart, a table, and a bar graph.
Curated OER
Tally Chart/Pictograph
In this graphic organizer worksheet, students can record their own data on this tally chart/pictograph. There are two columns and six rows with room for a title.
Curated OER
Graphing Data
First graders learn how to display data using a bar graph. In this bar graph lesson, 1st graders use data from a t-shirt color survey to make a bar graph. They also make an animal bar graph before interpreting the information.
National Security Agency
Starting a Restaurant
Through an engaging unit, chefs-in-training will sort and classify data using tally charts. Learners will also create bar graphs to display restaurant data and interpret data from bar graphs using a variety of categories. This is a fun...
Curated OER
M&M Graphing
Youngsters sort M & M's by color. They graph the M&M's by color on a graph. This classic instructional activity is a wonderful way to introduce the concept and technique of graphing to young mathematicians. Pairs of kids can make...
Curated OER
Favorite Sports Graph
In this data collection and graph worksheet, students ask each classmate which sport is their favorite based on the ones shown at the bottom of the graph. They color a square for each response, and tell the most and least popular sport.
Curated OER
Pike Problems in Lake Davis
Pike fish pose a threat to native trout and catfish in lakes. Would you drain and poison a lake to get rid of the Pike fish? If the lake was drained and poisoned, then refilled and repopulated with trout and catfish, how would you...
Curated OER
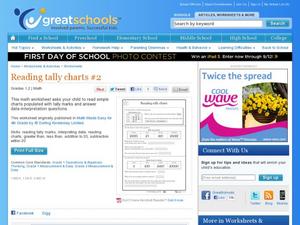
Reading Tally Charts #2
Keep count with tally marks! First graders practice reading tally marks with this straightforward learning exercise. They work with interpreting data from a chart, as well as working with addition and subtraction under 20. A great math...
Curated OER
Yummy Math
Young mathematicians use bags of Skittles to help them gain practice in graphing and organizing data. They work in pairs, and after they have counted and organized their Skittles, they access a computer program which allows them to print...


