Curated OER
Raising the Bar While Hogging the Ham (Radio, That Is)
Young scholars watch a Cyberchase video to determine the importance of using the correct scale when making bar graphs. They examine how to use bar graphs to gain information easily. They determine how to use bar graphs persuasively.
Curated OER
Bouncing Ball Experiment
Students collect data for a bouncing ball and select one bounce to analyze. They explore the relationship between velocity, position and acceleration. They seek out connections between the graphs and the physical motion of the ball.
Cheetah Outreach
Life Cycles
How does a cheetah life cycle differ from a human life cycle? Kids graph weight gain for humans versus cheetahs and compare other life cycle events such as gestation and life span
Curated OER
Exploring Circles
Learners explore circles using a graphing calculator. In this circles lesson, students write the equation of a circle with a given center and radius length. Learners find the most appropriate model for each combination of data they...
Texas Instruments
Let's Play Ball with Families of Graphs
Learners explore quadratic equations in this Algebra II lesson. They investigate families of quadratic functions by graphing the parent function and family members on the same graph. Additionally, they write the equation of the parabola...
Curated OER
Atlatl Lessons Grade 4-12
Students experiment with velocity, ratios, and rates. In this data management activity, students throw a dart with and without using an atlatl and collect and record various data. Students construct ratios based on the data and determine...
AIMS Education Foundation
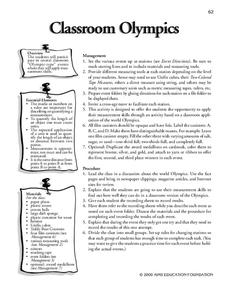
Classroom Olympics
As the Summer Olympics are approaching, incorporate Olympic-type games into the classroom. From straw javelin to cotton ball shot put, these games are sure to keep leaners engaged. The best part is that there is math involved! Pupils...
Achieve
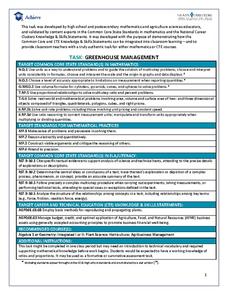
Greenhouse Management
Who knew running a greenhouse required so much math? Amaze future mathematicians and farmers with the amount of unit conversions, ratio and proportional reasoning, and geometric applications involved by having them complete the...
Curated OER
"You're Hired!'
Students investigate linear programming using the TI. In this algebra lesson, students collaborate and graph linear inequalities on a TI. They analyze their data and present it to the class.
Curated OER
Weather Watchers
Students collect and analyze data about the weather. For this algebra lesson, students organize and graph their data using graphs, line plots and stem and leaf plots. They make observation and draw conclusion using their data.
Curated OER
Analyzing Health
Third graders analyze their health. In this analysis lesson plan, 3rd graders rate their health on a 1-10 scale. They then tally the scores from the class and create a data chart. Then they answer true and false questions based on...
Curated OER
Be A Bug Scout
Students perform outside activities to determine the amount of insects, flowers, or common weeds within an area. They predict the number of insects they will find within their square area. Using calculators, students organize the data...
NOAA
Sustaining Our Ocean Resources
Lead young scientists on an investigation of fishery practices with the final installment of this four-part unit. Using a PowerPoint presentation and hands-on simulation, this instructional activity engages children in learning how fish...
Curated OER
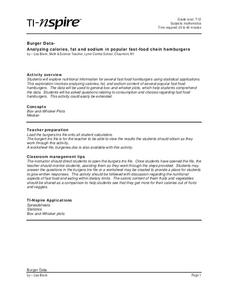
Box-and-Whisker Plots
Students explore nutritional information for several fast food hamburgers using statistical applications. In this statistics lesson, students analyze calories, fat, and sodium content of various fast food restaurants. Students also...
Curated OER
Exploring Quadratic Graphs
Young scholars solve quadratic equations using graphs. In this algebra lesson plan, students factor quadratic equations and graph their answer. They discuss the shape of their graph based on the function.
Curated OER
The Tale of Scale
Eighth graders, using a range of data, produce three bar graphs for various scales along the y-axis.
Curated OER
Raising the Bar While Hogging the Ham (Radio That Is)
Students create a bar graph that communicates an amount without the need to know the exact data, determine what scale to use to best represent the data and use their bar graph to persuade others.
Curated OER
Count The Letters
Students perform activities involving ratios, proportions and percents. Given a newspaper article, groups of students count the number of letters in a given area. They use calculators and data collected to construct a pie chart and bar...
Curated OER
Gravity, Angles, and Measurement
Students relate math to real life scenarios. In this geometry lesson, students launch a ball tracking each launch using a graph. They analyze their data for speed, angles and distance, trying to improve on each launch.
Curated OER
How Fast Is Your Car?
Eighth graders discover the relationship between speed, distance, and time. They calculate speed and represent their data graphically. They, in groups, design a ramp for their matchbox car. The goal is to see who's ramp produces the...
Curated OER
Walk the Line
Learners create constant speed versus motion graphs. They will perform linear regressions on their data to describe the graphs mathematically.
Curated OER
Counting
Second graders comprehend how to use two different kinds of graphs. They complete a worksheet with the help of the teacher and a bag of jellybeans and then another worksheet without the direction of the teacher. Students listen as the...
Curated OER
Help! I Need Five Minutes
Students practice ways to better manage their time. They keep track of their current use of time. Students prioritize and schedule events and use a daily planning calendar to schedule their time.
Curated OER
The Lake Effect
Fourth graders conduct an experiment demonstrating the effects of water and air temperature on precipitation. They create graphs demonstrating their findings using Claris Works for Kids.


