Curated OER
Using Matrices to Enter Data and Perform Operations
Here's a TI step by step guided lesson on matrices. The class enters data into the TI calculator about movie ticket sales and uses matrices as a problem solving tool. They add and multiply matrices to determine profit.
Kenan Fellows
Designing and Analyzing Data Collected from Wearable Devices to Solve Problems in Health Care
Wearable devices have become more the norm than the exception. Learners analyze data from a sample device with a regression analysis in a helpful hands-on lesson. Their focus is to determine if there is a connection between temperature...
Curated OER
Application of Matrix Multiplication
The class explores a real-world application in which the data represents rental prices of beach condos. They problem solve by multiplying matrices to determine the cost of each property in each season. Several scenarios are presented in...
Curated OER
NUMB3RS - Season 2 - "Convergence" - Air Hockey
Learn how to use a matrix to organize data to solve a problem. This activity uses wins and losses to rank players for an air hockey tournament they wish to have. After practicing some basic matrix operations the class could do the...
Curated OER
Vernier EasyData App
Used along with data collection devices, the EasyData Application for the TI-83 Plus/TI-84 calculator allows learners to use real data to learn math and science. Statistics, curve fits, and integrals are used to analyze the collected...
Willow Tree
Approximating a Line of Best Fit
You may be able to see patterns visually, but mathematics quantifies them. Here learners find correlation in scatterplots and write equations to represent that relationship. They fit a line to the data, find two points on the line, and...
PBL Pathways
Maximizing Movie Revenue
Can theaters increase profits by raising or lowering ticket prices? Using data from the National Association of Theater Owners, classes consider this question. The project-based learning activity includes both a profit and revenue...
EngageNY
Using Matrix Operations for Encryption
Data encryption is an important security measure for sensitive data stored on computers. Pupils learn how to utilize matrices for creating code. They also get a great review of matrix multiplication, inverse matrices, and the identity...
Kenan Fellows
Lego Thinking and Building
Run a simulated airplane manufacturing plant with your pupils as the builders! Learners build Lego airplane models and collect data on the rate of production, comparing the number produced to the number defective. Using linear...
Curated OER
Monopoly Graphs
Learners relate the concepts of linear functions to the game of monopoly. In this algebra instructional activity, students solve problems with ratio and proportion. They collect data and graph it.
Radford University
Budgeting Your Time and Money
Use mathematics to better manage money. Pupils learn about budgets and personal finance with a set of three lessons. They research salary data for their chosen careers, look up various costs of living to develop budgets, and plan an...
Curated OER
Exploring Circles
Students explore circles using a graphing calculator. In this circles lesson, students write the equation of a circle with a given center and radius length. Students find the most appropriate model for each combination of data they...
Curated OER
"You're Hired!'
Students investigate linear programming using the TI. In this algebra lesson, students collaborate and graph linear inequalities on a TI. They analyze their data and present it to the class.
Curated OER
Weather Watchers
Students collect and analyze data about the weather. In this algebra lesson, students organize and graph their data using graphs, line plots and stem and leaf plots. They make observation and draw conclusion using their data.
Curated OER
Count the Differences
Pupils find the difference between consecutive y-values on the calculator and write an equation that fits the data. They continue finding the differences in consecutive y-values using lists on their calculator. Learners conclude as they...
Curated OER
Find Minimum and Maximum
Learners engage in a lesson about finding the values of different graphs written in the vertex form. They rewrite each quadratic equation in vertex form while graphing the equation with the visual display of a parabola that matches the...
Curated OER
Graphing Real World Situations
Students solve linear equations using graphs. For this algebra lesson, students depict real life situation using lines and functions. They identify the slope, data and predict graphing behavior.
Curated OER
Instantaneous Rate of Change of a Function
Pupils draw the graph of a door opening and closing over time. They graph a given function on their calculators, create a table of values and interpret the results by telling if the door is opening or closing and evaluate the average...
Curated OER
Around the Clock
Learners discover the relationship between the circumference of a circle and its diameter. They find the length of an arc of a circle.Students use estimation strategies in real-world applications to predict results (i.e., interpolation...
Curated OER
Two-Variable Linear Inequalities
Here is an engaging lesson plan on solving equations with two variables. Have the class rewrite linear equations in the slope intercept form, y=mx + b. They graph the lines using the slope and y-intercepts.
Curated OER
Logistic Growth
Through the exploration of population growth of a bacteria population, students learn about and observe bacteria population over a 20 hour period. Students graph the population growth using a scatter plot and discuss its logistic...
Texas Instruments
Let's Play Ball with Families of Graphs
Learners explore quadratic equations in this Algebra II instructional activity. They investigate families of quadratic functions by graphing the parent function and family members on the same graph. Additionally, they write the equation...
Curated OER
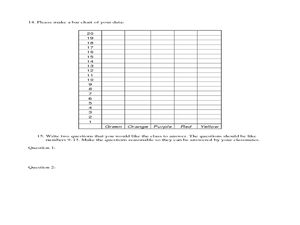
Using Ratios to Taste the Rainbow
Students solve problems using ratios and proportion. For this algebra lesson, students analyze skittles and their different colors as they apply the properties of ratios and proportions to solve their problems.
Curated OER
Properties of Logarithms
Learners investigate properties of logarithmic function as they add, subtract and multiply logarithms. They graph and analyze the graph for exponential equivalency.
Other popular searches
- Measurement Data Management
- Data Management Story
- Math and Data Management
- Math Lesson Data Management
- Data Management and Graphing
- Data Management Computing
- Data Management Analysis
- Data Management Math
- Data Management Lesson Plan
- Data Management Math Lessons
- Data Base Management Systems
- Business Data Management


