EngageNY
Sampling Variability and the Effect of Sample Size
The 19th installment in a 25-part series builds upon the sampling from the previous unit and takes a larger sample. Pupils compare the dot plots of sample means using two different sample sizes to find which one has the better variability.
Curated OER
Sampling Distribution of Sample Means
Students collect data and crate a distribution sample. In this statistics activity, students compare and contrast their collected data. This assignment requires the students to be comfortable with navigating the internet.
Curated OER
Comparing Linear and Exponential Data
Students graph linear and exponential equations. For this algebra lesson, students differentiate between linear and exponential equations. They relate it to the real world.
Curated OER
How Many More on a Graph?
First graders examine data on a graph and determine which variable on the graph has more. They draw pictures of their family members and determine which families have more members than other families. Using squares of paper to depict...
Curated OER
Yummy Math
Young mathematicians use bags of Skittles to help them gain practice in graphing and organizing data. They work in pairs, and after they have counted and organized their Skittles, they access a computer program which allows them to print...
Curated OER
Math: Real Time and Live
Get an interdisciplinary edge. Scholars study air contamination and slope. They record the time it takes for air fresheners to reach them at variable distances. They document their times, classify them by distance, and draw a scatter...
Curated OER
Monopoly Graphs
Students relate the concepts of linear functions to the game of monopoly. In this algebra lesson, students solve problems with ratio and proportion. They collect data and graph it.
Curated OER
Creating and Reading a Pictograph
Second graders examine how data can be transferred into pictures on a pictograph. They analyze data on a graph about chewing gum, and create a pictograph that illustrates data about their preferences for the taste of bubble gum. ...
Curated OER
Linear Equations Data Tables
Students graph linear equations on a Cartesian plane. After describing data tables and their use, students explore how the information from a table can be used to create a line graph. They discuss reasons for plotting a minimum of...
Curated OER
Patterns Here, There and Everywhere
Pattern recognition is a skill often used in mathematics. Learners count and sort manipulatives, organize the data into a graph and answer questions about the information displayed. They collect the objects to be used and create patterns...
Curated OER
Bouncing Ball Experiment
Students collect data for a bouncing ball and select one bounce to analyze. They explore the relationship between velocity, position and acceleration. They seek out connections between the graphs and the physical motion of the ball.
EngageNY
From Ratio Tables, Equations and Double Number Line Diagrams to Plots on the Coordinate Plane
Represent ratios using a variety of methods. Classmates combine the representations of ratios previously learned with the coordinate plane. Using ratio tables, equations, double number lines, and ordered pairs to represent...
Curated OER
Exploring Circles
Students explore circles using a graphing calculator. In this circles instructional activity, students write the equation of a circle with a given center and radius length. Students find the most appropriate model for each combination of...
Curated OER
Taste the Rainbow
Students practice estimating and graphing by utilizing Skittles. For this statistics lesson, students complete worksheets based on the likelihood of a certain color of skittle coming out of the bag. Students create a graph based on the...
Curated OER
Separating Soup Mix
Students use screens of three sizes to separate a mixture of five solid materials. They plan and conduct simple investigations using appropriate tools, measures, and safety rules and record and report observations, explanations, and...
Texas Instruments
Data Collection for Bar Graphs
Learners study the concept of central tendency in this data collection for bar graph instructional activity. They collect data outside as instructed and organize it into a bar graphs, then they list in specific groups the labels that...
Curated OER
Let's Build a Worm Bin
Learners explore the process of decomposition. In this ecology and measurement instructional activity, students prepare a worm home to be used for vermicomposting. Learners weigh a group of worms and the added food, recording this...
Curated OER
Applied Science - Built Environment Lab
Students evaluate trash. In this Science lesson, students collect and weigh trash from their classrooms. Students categorize the trash and the corresponding weights, recording the information on a data sheet.
Curated OER
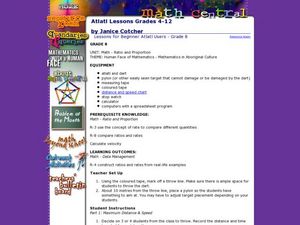
Atlatl Lessons Grade 4-12
Students experiment with velocity, ratios, and rates. In this data management lesson plan, students throw a dart with and without using an atlatl and collect and record various data. Students construct ratios based on the data and...
Curated OER
IT IS ABOUT SUPPLY AND DEMAND.
Students learn that the price of an item is defined by its supply and demand. In this lesson students graph the relationship between demand and supply of various products, students also consider hidden costs.
AIMS Education Foundation
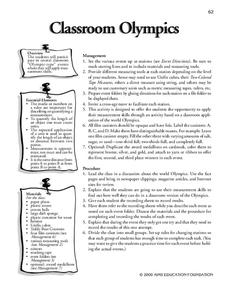
Classroom Olympics
As the Summer Olympics are approaching, incorporate Olympic-type games into the classroom. From straw javelin to cotton ball shot put, these games are sure to keep leaners engaged. The best part is that there is math involved! Pupils...
Curated OER
"You're Hired!'
Students investigate linear programming using the TI. In this algebra lesson, students collaborate and graph linear inequalities on a TI. They analyze their data and present it to the class.
Curated OER
Weather Watchers
Learners collect and analyze data about the weather. In this algebra lesson, students organize and graph their data using graphs, line plots and stem and leaf plots. They make observation and draw conclusion using their data.
NOAA
Sustaining Our Ocean Resources
Lead young scientists on an investigation of fishery practices with the final installment of this four-part unit. Using a PowerPoint presentation and hands-on simulation, this instructional activity engages children in learning how fish...
Other popular searches
- Measurement Data Management
- Data Management Story
- Math and Data Management
- Math Lesson Data Management
- Data Management and Graphing
- Data Management Computing
- Data Management Analysis
- Data Management Math
- Data Management Lesson Plan
- Data Management Math Lessons
- Data Base Management Systems
- Business Data Management


