Curated OER
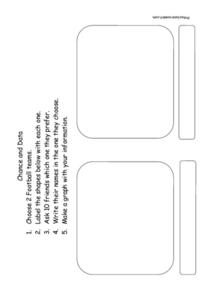
Chance and Data
In this graphing a survey worksheet, students poll 10 friends to see which of 2 football teams is their favorite and then graph their data results.
Curated OER
Using Intercepts to Interpret Data
Students analyze data from a class read-a-thon. They graph equations using x- and y-intercepts and solve one and two-step linear equations.
Curated OER
Best-Selling Books Bar Graph
Create a bar graph with your elementary school learners. First they read and interpret data, and then they color in the graph (provided) to indicate how many of each were sold. Consider providing them with the data but having them...
Math Mammoth
Line Graphs 3
For this line graphs instructional activity, students make a triple-line graph from a list of given data and then answer three comprehension questions regarding the line graph.
Curated OER
Investigating: Interpreting Graphs and Analyzing Data
Students explore statistics by researching class birthday data. In this data analysis lesson, students investigate the different birthdays among their classmates and create data tables based on the given information. Students view bar...
Curated OER
Looking at Data
Third graders use two days to create, collect, display and analyze data. Classroom activities and practice build greater understanding to a variety of forms used to display data.
Curated OER
Graphing Family Reading Habits
Second graders collect data from their families about their reading habits and graph them. In this graphing family reading habits lesson, 2nd graders interview family members about their reading habits. They then use a graphing computer...
Curated OER
Graphing With Paper and Computers
Fourth graders construct bar graphs. For this graphing lesson, 4th graders create bar graphs in connection with the story, The Copycat Fish. After creating the initial graphs on paper, students use MS Excel to create graphs.
Curated OER
Which Bag is Which?
Students explore number sense by completing a statistical analysis game in class. In this data graphing lesson, students utilize visual references such as colored cubes and tiles to map out the results of an experiment outcome such as a...
Curated OER
Exploring Careers
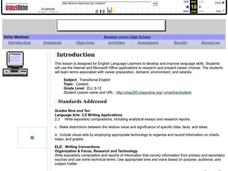
The world is full of possibilities for your ELLs. Help them explore their career options with a lesson that incorporates Internet research and expository writing. Not only will they learn more about their careers of choice, but both...
Curated OER
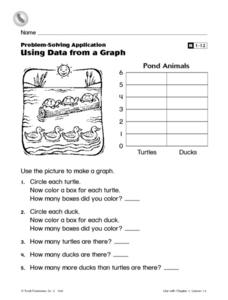
Using Data From a Graph
In this graphing learning exercise, learners create a bar graph with information from a picture of some pond animals. Students answer 5 questions about the graph.
Curated OER
Organizing and Interpreting Data
In this organizing and interpreting data learning exercise, students solve and complete 10 different problems related to reading various data tables. First, they complete the 3 charts shown with the correct tally amount, frequency...
Curated OER
Graphing
Students collect data to create different types of graphs-line, pie, and bar graphs. They use StarOffice 6.0 to create graphs.
Curated OER
Gummy Bear Math
First graders predict, collect data, and create a graph based on gummy bear colors they are given. In this graphing lesson plan, 1st graders first predict how many colors of gummy bears there are. They then count the colors, graph them,...
Curated OER
Cricket Weather
In this collecting data learning exercise, 4th graders use the data collected on crickets chirps and the temperature to make a line graph by following 4 directives.
Curated OER
Color Graphs and Poetry
Students explore color as they create graphs, write poetry, and examine varied interior designs. They respond to writing prompts describing their favorite color. Students collect data and create a bar graph based on a class survey. They...
Curated OER
Gathering, Recording, and Presenting Data
Sixth graders use the local newspaper to find and discuss examples of uses of statistics and the ways in which the information is presented. They create and represent their own set of data showing how students get to school each day.
Curated OER
Virtual Field Trip: Lesson Ten - Publishing
Class members publish a letter describing their Virtual Field Trip incorporating data from previously developed charts, graphs, and data tables. The final lesson plan in a series devoted to collecting information and publishing data.
Curated OER
The Write Stuff
Fourth graders share a previously written portfolio piece and the class guesses the genre. Students use tally marks to keep track of how many of each piece there are in class. Once the data collection is complete, 4th graders create a...
Curated OER
Statistical Pictures of School and Life
Students explore how mathematical data is used to summarize and illustrate everyday life. They apply mathematical concepts and skills to analyze data. Students conduct a five question survey of 50 people or more and graph the data.
Curated OER
Looking for More Clues
Fifth graders explore how to collect data and display it on a bar and circle graph.
Curated OER
The Appearance of a Graph
Sixth graders understand that the appearance and increment used on the x and y axis in a graph change how it looks. In this graphing activity, 6th graders work in pairs and interpret graphs using different axes. Students collect graphs...
Curated OER
Valentine Candy Count
Students analyze a bag of Valentine candy to create a graph. In this graphing activity, students make predictions, sort by color, record data and make a graph. Students discuss results and make generalizations. Students generate their...
Curated OER
Baseball Statistics
Students read "Casey at the Bat" and then use individual player statistics (found through internet research)to determine if their players could be considered baseball "heroes". They must justify their choices for "hero" by creating...
Other popular searches
- Graphing Data
- Graphing and Analyzing Data
- Graphing Data Project
- Collecting and Graphing Data
- Graphing Data in Science
- Collecting Data Graphing
- Organizing and Graphing Data
- Mathematics Graphing Data
- Data Tables and Graphing
- Graphing Information
- Line Graphing Data
- Graphing Data in Astronomy


