Curated OER
Determining the Existence of Gender Bias in Daily Tasks
Help your kids explore gender bias. Learners design and conduct a survey examining role responsibilities within families. They determine the percentage of responsibilities for males vs. females and graph the results. Then they analyze...
Curated OER
Fish Communities in the Hudson
Learning to read data tables is an important skill. Use this resource for your third, fourth, or fifth graders. Learners will will study tables of fish collection data to draw conclusions. The data is based on fish environments in the...
Curated OER
Reading the Neighborhood
First graders complete activities with the story One Monday Morning in the Macmillan/McGraw Hill Textbook. In this data lesson, 1st graders read the story and gather data to create a picture graph. They read the graph and answer...
Curated OER
Shaky New Zealand
Students explore geography by answering study questions in class. In this plate tectonics lesson, students identify the earthquake data concerning the country of New Zealand and answer questions regarding the data. Students identify...
Curated OER
Froot Loops to the Max- Pie 2
In this Froot Loops to the Max worksheet, students solve 2 different problems related to graphing data with a box of Froot Loops cereal. First, they complete the circle/pie graph using the given data including a key and a title for their...
Curated OER
Misleading Graphs
Students explore number relationships by participating in a data collection activity. For this statistics lesson, students participate in a role-play activitiy in which they own a scrap material storefront that must replenish its stock....
Curated OER
Make a Graph
In this graphing learning exercise, 1st graders use given data to create a graph and answer questions. In this problem solving learning exercise, students solve five problems.
Curated OER
Going Graph-y
Second graders listen to and dicuss the story Where the Wild Things Are. They play a pantomime game and act out various feelings so their classmates can guess. They listen for the frequency of certain words, and record their findings on...
Centers for Disease Control and Prevention
Major Disparities in Adult Cigarette Smoking Exist Among and Within Racial and Ethnic Groups
Data indicates that some racial groups smoke more than others, and that with that racial group, there are smaller groups whose smoking habits vary as well. Secondary learners read a graph that details the differences between the Asian...
Curated OER
Using Matrices for Data
In this matrices for data worksheet, 9th graders solve and complete 29 various types of problems that include using matrices to illustrate data. First, they determine the sum, difference and scalar product for each matrices shown. Then,...
Curated OER
Data Management and Probability: Applications
In this data management and probability applications worksheet, 7th graders solve 13 different types of problems that include finding the mean, median, mode, and range of each set of values, as well as, solving a number of word problems....
Curated OER
Line Graphs Showing Change Over Time
Students analyze line graphs. For this graphing lesson, students analyze line graphs paying attention to how the data changes over time. This lesson includes two video clips, one demonstrating an increasing line graph and one...
Curated OER
Earthquake on the Playground
Students investigate earthquakes by examining chart data. In this disasters lesson, students identify the waves that are recorded when an earthquake arises by reading sample graphs in class. Students participate in an earthquake...
Curated OER
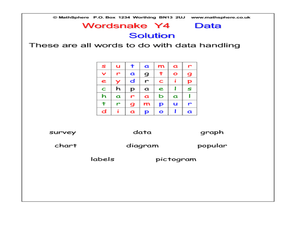
Word Snake: Data
In this data worksheet, students search for words in a word snake, which works like a maze, for words that represent data. Students search for 8 words.
Curated OER
M & M Madness
M&M's are always a great manipulative to use when teaching math. In this graphing lesson plan, learners predict how many of each color of M & M's there are. They count up each color and plug the data into a graph using the...
Curated OER
Wind Effects- A Case Study
Students explore hurricanes. In this weather data interpretation lesson, students draw conclusions about the impact of Hurricane Floyd as it related to weather conditions. Students read and interpret a tide data table, a barometric...
Curated OER
Tables, Charts and Graphs
Students examine a science journal to develop an understanding of graphs in science. In this data analysis lesson, students read an article from the Natural Inquirer and discuss the meaning of the included graph. Students create a...
Curated OER
Surname Survey
Young scholars use data from the U.S. Census Bureau to determine whether last names in a local phone directory reflect the Census Bureau's list of the most common surnames in the country. In this surnames lesson plan, students use the...
Curated OER
Populations and Life Cycles
Students explore biology by researching ocean statistics. In this data analysis instructional activity, students conduct a snail examination experiment utilizing live pouch snails. Students collect data about the snails over the course...
Curated OER
James and the Giant Peach Plot Analysis
It's all about the plot, main events, and story mapping with this lesson. As the class reads the novel James and the Giant Peach, they create an excitement graph that actually charts key events and moments of excitement. After creating...
Curated OER
Graphing and Analyzing
In this graphing and analyzing worksheet, 9th graders first state if each graph represents a linear or nonlinear relationship. Second, they create a difference table for each set of data presented and determine whether it represents a...
Curated OER
Aboriginal Statistics
Fourth graders analyze statistics of Native Americans by creating graphs. In this data analysis lesson, 4th graders define different statistical terms and practice finding those statistics from groups of numerical information about...
Curated OER
Opinion Poll-arities
Young scholars explore the mathematics behind opinion polls, as well as provides a framework for interpreting trends in opinion poll graphics.
Curated OER
Science: Teddy Bear Nation
Young scholars sort teddy bears according to types and then graph the results. They each bring a bear to class and then discuss their similarities and differences. Once the bears have been sorted into groups according to size and color,...
Other popular searches
- Graphing Data
- Graphing and Analyzing Data
- Graphing Data Project
- Collecting and Graphing Data
- Graphing Data in Science
- Collecting Data Graphing
- Organizing and Graphing Data
- Mathematics Graphing Data
- Data Tables and Graphing
- Graphing Information
- Line Graphing Data
- Graphing Data in Astronomy


