Curated OER
What Goes Up Must Come Down!
Students hypothesize about the nature of falling objects, design an experimental test to answer the question using everyday objects, analyze data to form conclusions, and infer that mass does not affect the speed of falling objects. This...
Curated OER
Weights and Measures
Young scholars master the gathering, averaging and graphing of data. They practice conversion to metric measures. They gain fluency in the use of technology tools for math operations.
Curated OER
Checking County Numbers
Students use their county's information page to gather information about their community. Using the information, they create graphs from the tables provided and interpret the data. They write a paragraph showing their interpretation of...
Curated OER
Reaching New Heights
Students explore the relationship between two variables. Students measure their arm span and height. They gather this class data to design a scatter plot. Students interpret the meaning of individual coordinates and the overall graph....
Curated OER
Human Evolution
Students make and use observations of Laetoli footprints to provide clues to life in the past. They collect and analyze data to study the relationship between foot length and body height.
Curated OER
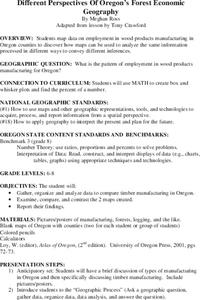
Different Perspectives of Oregon's Forest Economic Geography
Middle schoolers locate the many forests located in Oregon. In groups, they use the internet to research employment data on wood products made in the state. They discuss how looking at information presented in a different way can...
Curated OER
Code Breakers
Learners collect data and make a frequency table, change ratios into percents, and analyze data to make predictions.
Curated OER
Name Count and Graph
Young scholars find the frequency of a name in selected states by using the Internet. They input data into a spread sheet. They create a graph that illustrates the gathered information.
Curated OER
Keypals and You
Students collect and compare data received from keypals. They use electronic mail to exchange information with keypals and rrite a paper comparing similarities and differences between themselves and their keypals. In addition, use a...
Curated OER
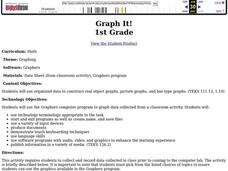
Graph It!
First graders use organized data to construct real object graphs, picture graphs, and bar-type graphs.
Curated OER
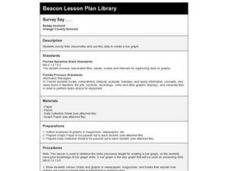
Survey Say...
Students examine a variety of charts and graphs that present data in a format that is easy to read. They work in groups to conduct a survey amongst their classmates. The data collected from the survey is then put on a bar graph.
Curated OER
Stats on Reduced-Fat
Students demonstrate an understanding of the Five-Number Summary and Box-Plots after analyzing data from nutrition labels, forming a hypothesis and supporting it. They decide if there is a significant difference between reduced fat and...
Curated OER
Line Of Best Fit: Feet & Forearms
Students actively find the line of best fit. They gather their own data and then use a calculator to find the line of best fit, as well as the equation. They see how to use the TI 81 calculator in order to find the line of best fit.
Curated OER
The Demise of Copper's Trading Power
Eighth graders evaluate statistical equations. They examine data from archaeologists at Jamestown, complete statistical equations using the sets of data, and graph the results.
Curated OER
Fast Food Survey Using Bar Graphs
Second graders conduct survey and sort data according to categories, construct bar graph with intervals of 1, and write a few sentences about their graphs.
Curated OER
Agriculture, Weather, Economy and Indiana
Fourth graders, in groups, investigate the role of weather in Indiana's farming economy. They make a prediction as to weather and its effect on the economy of Indiana. They present their data using a media presentation of data...
Curated OER
Is Coming to the United States of America Good For the Immigrant?
Students evaluate impact of American politics, economy, culture, and environment on the immigrant, gather first person data, and use it to develop a persuasive presentation.
Curated OER
Why Do Immigrants Come to the United States of America?
Students appreciate the diversity of motives for immigration to the United States. They gather first person data and develop a persuasive presentation. They create a historical comparison of the motives for immigration to the community.
Curated OER
Using Science Skills to Investigate Japanese Quail
Sixth graders explore Japanese Quail. They generate and record scientific questions about the quail. Students gather information from various sources and record their data. They compose an inquiry report and include it in a portfolio.
Curated OER
Merge Letter
Pupils practice creating a database of addresses and a form letter and eventually merge that information into a letter. They create a from letter that incorporates the data sheet information in response to customers complaints concerning...
Curated OER
Occupational Outlook
Young scholars analyze collected data to determine the occupational outlook for a variety of careers. This social studies instructional activity for the high school classroom is ideal for student practice using spreadsheet software,...
Curated OER
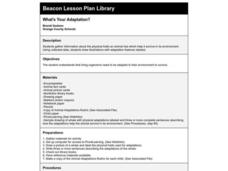
What's Your Adaptation?
Second graders gather information about the physical traits an animal has which help it survive in its environment. Using collected data, 2nd graders draw illustrations with adaptation features labeled.
Curated OER
Heavy Breathing
Students investigate asthma and air quality, and then map or graph the incidence of asthma by county and air quality information by county in the state of Maryland. They attempt to see any correlations and note any limitations of the data.
Curated OER
Hurricanes
Eighth graders gather information on hurricanes that are affecting the world at the time of the lesson. They work together in groups to collect the data and record their information in a table. They are asked questions to finish the lesson.
Other popular searches
- Science Data Gathering
- Gathering and Graphing Data
- Data Gathering Strategies
- Gathering Qualitative Data
- Data Gathering Tests
- Gathering and Charting Data
- Math Data Gathering
- Math, Data Gathering
- Gathering Weather Data
- Data Gathering and Analysis
- Errors in Data Gathering
- Data Gathering Accuracy


