Curated OER
The Phantom of the Computer Lab
Students calculate the power consumption of computers in school. In this physics lesson, students design an experiment to determine whether the school should unplug computers at the end of the day. They collect data and report findings...
Curated OER
Water Down the Drain
Did you know that leaky faucets waste $10 million worth of water? Conservationists perform an experiment and draw best-fit lines to explore how the US Geological Society determined this value.
Curated OER
Superbowl XXXVII Ads: Who Wins Here?
Students research what experts and viewers thought about the commercials shown during Super Bowl XXXVII, paying special attention to the reason ads very popular or not. Students prepare a notebook or a PowerPoint presentation on the Best...
Curated OER
What Are Your Chocolate Eating Habits?
Students design and conduct a survey as an investigation of chocolate eating habits. They pool and analyze their results and consider which companies are making the largest profits based on the information gathered from their surveys.
Curated OER
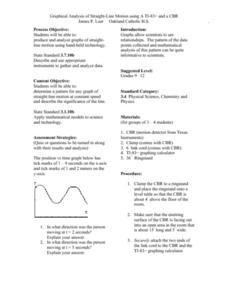
Graphical Analysis of Straight-Line Motion
Students investigate the concept of straight line motion. They determine the pattern and graph it looking for the motion maintained at a constant speed. Students also write a description of the significance of the line. The skill of...
Curated OER
Local Heart Rates
Pupils determine the type of data needed to test their inferences. As homework, they check and record heart rates of fellow students, teachers and family members. During their next class period, pupils enter all data into the database.
Curated OER
Measuring "pHacts" about Acid Rain
Sixth graders gather and graph information regarding the pH of rain. Working cooperatively with an internet partner, 6th graders gather and record information about the pH of the rain in their local area. They graph this information...
Curated OER
Tech Algebra: A Statistics Study
Students use the internet to gather a minimum of thirty pieces of data. Students create box and whisker graphs, and stem and leaf plots from the information. They calculate mean, median, mode, and range. Students write a summary and...
Curated OER
Is Temperature Effected By How Close You Are to the Equator
Students collaborate with other schools to gather temperature data from a large number of locations. They determine how the average daily temperature of a location is affected by how close you are to the equator.
Curated OER
Learning By Bees
Students investigate learning by bees as related to vision and foraging behavior. The experiment is done outdoors where bees are foraging for food. They make their observations and record their data which is shared with the class.
Curated OER
Drip, Drip, Drip
Pupils gather scientific data and be able to utilize the data to generalize results over a long period of time. They use the appropriate tools to measure quanities of liquids and analyze the data to determine the cost of a leaky faucet.
Curated OER
Compare Your Air
Learners will compare the data for different locations that they select and investigate trends over the course of a number of years. This will give the students an opportunity to apply statistical measures (mean, median,mode) to data...
Curated OER
A Woman's Place in the House of Commons
Students become familiar with the role women play in the Canadian government. They gather, organize and analyze data on female politicians.
Curated OER
Dating Practices
Students interpolate, extrapolate, and make predictions from given information. They present results and conclusions from given data using basic statistics. Pupils create a survey from a critical question and decide which sampling...
Curated OER
Put Your Heart Into It
First graders sort Valentine candies according to kind. Data is inserted into a spreadsheet and displayed in various graphic formats.
Curated OER
WW II Historical Pop-Up Page
Students research and chart events associated with World War II from 1935-1945 using a data retrieval chart in order to list in chronological order important dates and events with accuracy. Each student create a Historical Pop-Up Page.
Curated OER
Hurricanes-Disasters In the Making
Sixth graders discover the proper methods for plotting hurricanes while developing their understanding of hurricanes by researching and gathering tracking data from technological sources. Students develop a newsletter about hurricanes,...
Curated OER
Diagonal Lengths
Students collect, organize, and analyze data while studying the Pythagorean Theorem, measure length and width of several rectangular objects, and compare the measured results to the calculated results.
Curated OER
Earth Day Trash Survey Unit
Students develop a questionnaire to distribute via e-mail or Web page forms that visitors fill out based on the data they gathered during their clean-up activities.
Curated OER
I Love Navarre
Third graders use a research checklist to gather information for a brochure of their local area. students then use a Brochure Data List and Brochure Rubric to edit their brochure. They discuss and revise and create their final brochure.
Curated OER
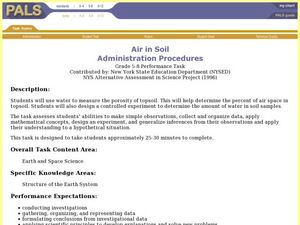
Air in Soil Administration Procedures
Young scholars study soil and its composition. In this soil composition lesson, students study examples of soil during several days of aeration. Young scholars summarize their data, organize it, and must be able to explain their findings.
Curated OER
Sunrise/Sunset
Students apply data from a weather-related website to predict patterns in the sunrise and sunset.
Curated OER
What Toothpaste Do You Use?
Students collect data about their favorite toothpaste and then graph the results of that data. They survey 15 of their friends to determine which toothpaste they use the most often and then color the graph to reflect the survey results.
Curated OER
Forecast Fever
Ninth graders investigate what high-tech tools are used to gather weather data and make weather forecasts. They view a video and a PowerPoint presentation, and conduct research on a cloud chart website. Students make local weather...
Other popular searches
- Science Data Gathering
- Gathering and Graphing Data
- Data Gathering Strategies
- Gathering Qualitative Data
- Data Gathering Tests
- Gathering and Charting Data
- Math Data Gathering
- Math, Data Gathering
- Gathering Weather Data
- Data Gathering and Analysis
- Errors in Data Gathering
- Data Gathering Accuracy


