Willow Tree
Histograms and Venn Diagrams
There are many different options for graphing data, which can be overwhelming even for experienced mathematcians. This time, the focus is on histograms and Venn diagrams that highlight the frequency of a range of data and overlap of...
Thomson Brooks-Core
Complex Numbers
A straightforward approach to teaching complex numbers, this lesson addresses the concepts of complex numbers, polar coordinates, Euler's formula, De moivres Theorem, and more. It includes a practice problems set with odd answers...
Granite School District
7th Grade CCSS Math Vocabulary Word List
Address key vocabulary in the seventh grade Common Core Math Standards with this comprehensive list. A series of word cards is also provided that supports each term with images and examples, making this an excellent tool for teaching the...
Deliberating in a Democracy
Cyberbullying—Alternate Lesson Plan
Should schools be permitted to punish young scholars for off-campus cyberbullying? After reading a passage that details statistics about cyberbullying and Supreme Court rulings about schools' ability to limit student speech,...
Virginia Department of Education
How Much is that Tune?
Tune in for savings! Scholars investigate pricing schemes for two different online music download sites. After comparing the two, they determine the numbers of songs for which each site would be cheaper.
Cuemath
Cuemath: Frequency Distribution Table
A comprehensive guide for learning all about frequency distribution tables with definitions, how to create a frequency distribution table, and the formulas and graphs related to frequency distributions. With solved examples and...
Science Struck
Science Struck: Types of Skewed Distribution With Real Life Examples
Explains what is meant by a skewed distribution, describes the two types, and gives examples.
National Snow and Ice Data Center
Nat. Snow and Ice Data Center: All About Glaciers: Where Are Glaciers Located?
Explains where glaciers can be found and what conditions are needed for them to exist. Includes a table showing where glaciers can be found around the world and the approximate areas. These figures were, however, from 2008.
Khan Academy
Khan Academy: Conditional Distributions and Relationships
A small private college was curious about what levels of students were getting straight A grades. College officials collected data on the straight A status from the most recent semester for all of their undergraduate and graduate students.
Math Is Fun
Math Is Fun: Standard Normal Distribution Table
An explanation of standard normal distribution along with a table of values.
National Snow and Ice Data Center
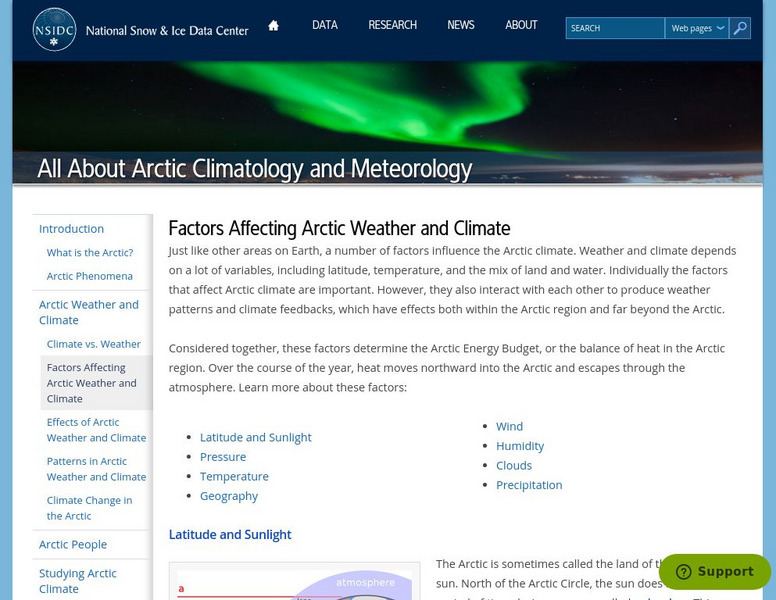
National Snow and Ice Data Center: Factors Affecting Arctic Weather and Climate
An introduction to the factors that affect the Arctic's weather and climate: latitude, land/sea distribution, solar radiation, air temperature, air pressure, winds, humidity, clouds, and precipitation.
Math Is Fun
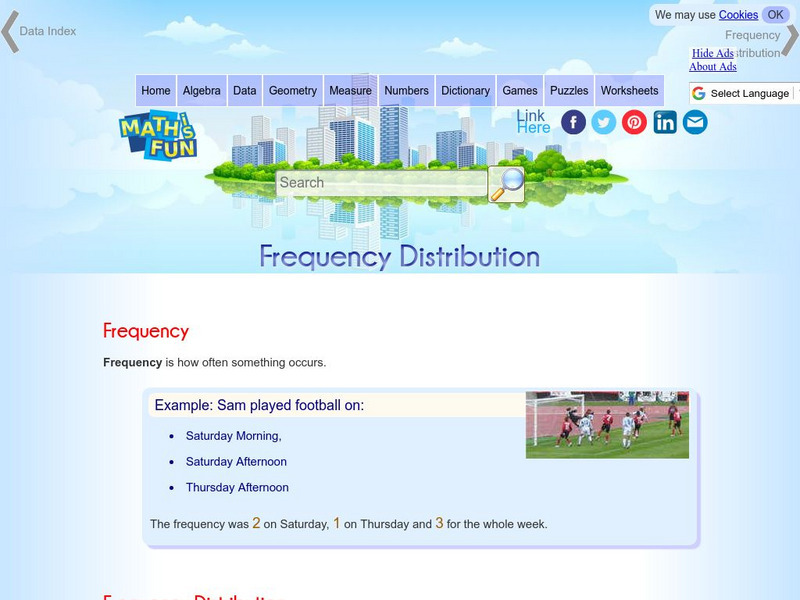
Math Is Fun: Frequency Distribution
Explains, with examples, what a frequency distribution table is. Includes a set of practice questions.
University of Baltimore
University of Baltimore: Sampling Distribution
A complete definition of sampling distribution as well as the beginning of a discussion concerning were sampling distribution fits into the topic of statistics. Written by Dr. Hossein Arsham.
US Geological Survey
U.s. Geological Survey: Water Science for Schools
A collection of resources--pictures, maps, data, glossary--about water and the water cycle.
Khan Academy
Khan Academy: Two Way Tables Review
Two-way tables organize data based on two categorical variables.
Other
Stat Soft: Statistics Glossary
Dozens of statistical terms are defined and illustrated in this glossary.
Other
Stat Soft: Getting Started With Statistics Concepts
Definitions of the basic concepts in statistics. Great for review and discussion or for introduction into topics.
Math Is Fun
Math Is Fun: Quincunx
The Quincunx is a fascinating probability machine that demonstrates how distribution works. This page has an interactive Quincunx where you can adjust how many rows there are for the balls to bounce down when dropped. A link takes you to...
Quia
Ixl Learning: Frequency Tables
Brush up on your math skills relating to frequency tables then try some practice problems to test your understanding.
Wolfram Research
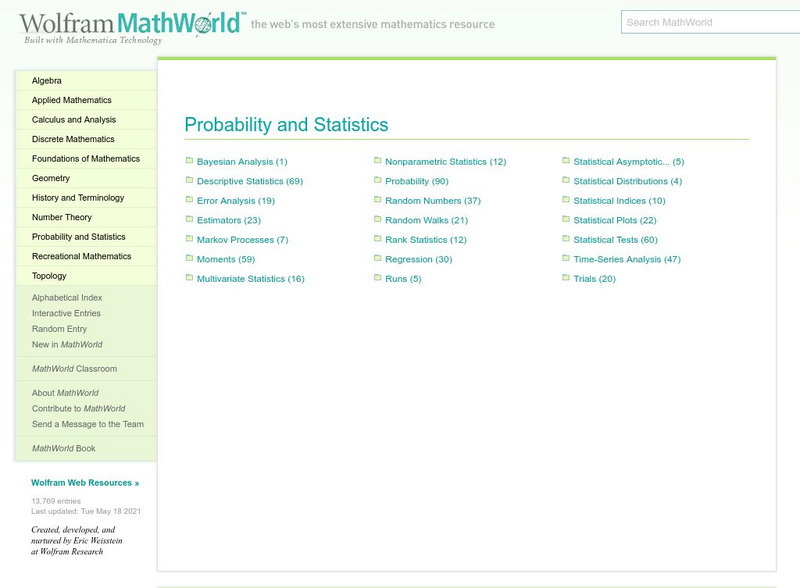
Wolfram Math World: Probability and Statistics
This is a resource for many topics in probability and statistics. Click on the topic of your choice for an explanation. The sites you will be linked to are quite extensive. A degree of higher-level math is necessary for understanding...
Other
The Evidence for Evolution: Biogeography
These pages are part of a site called "Evolution," that accompanies a textbook by the same name. Mark Ridley is the author. These pages are about the house sparrow and the differences that can be observed in it in different geographical...
Richland Community College
Richland Community College: Stats Graphs Defined
Richland Community College provides a glossary of many terms that are needed in order to understand statistics graphs and charts. Each of the types of charts is quickly explained in terms of what it is most effective in displaying.


