Curated OER
Why Would I Owe My Soul to the Company Store?
Sixth graders listen to "Sixteen Tons" by Tennessee Ernie Ford and discuss what it means to owe one's soul to a store. In this mathematics lesson, 6th graders determine what a miner's income was minus his expenses graphing findings in a...
Curated OER
Pumped Up Gas Prices
Learners calculate gas prices. In this transportation lesson, students tally the mileage and gas costs of their car for one months. They figure out how much was spent on gas and create a graph showing average gas prices over time.
Curated OER
Mapping The Ocean Floor
Young scholars explore and analyze the bottom structure of underwater habitats. They describe and explain what can't see through the collection and correlation of accurate data. Learners assess that technology is utilized as a tool for...
Curated OER
Slope
Students calculate the slope of a line. In this slope lesson, students use a graph, an equation or two points to help them calculate the slope of a line. They differentiate between a slope of zero and an undefined slope.
Curated OER
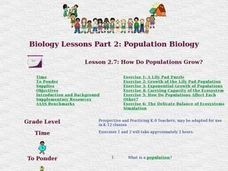
How Do Populations Grow?
Students examine how populations grow and how invasive species can affect the balance of ecosystems. They simulate the growth of lily pads, analyze and record the data, and simulate the results of an invasive species on an ecosystem.
Curated OER
Teenage pregnancy trends in Canada
Young scholars analyze demographic data relating to teen pregnancy trends. They develop skills to locate and interpret data. They discuss the factors that influence teenage pregancy such as social, economic, and educational issues.
Curated OER
Volume of Gas
Eighth graders investigate the effect of temperature on the volume of a gas in a closed container. They measure the height of the water in their beaker/container, conduct their experiment, and create a graph to illustrate their data.
Curated OER
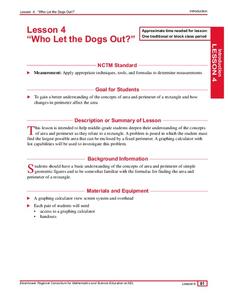
Who Let the Dogs Out?
Students examine the concepts of area and perimeter and how they relate to a rectangle. They find the largest possible area that can be enclosed by a fixed perimeter and complete a worksheet as well as create a table of all the possible...
Curated OER
Ocean Currents and Sea Surface Temperature
Students use satellite data to explore sea surface temperature. They explore the relationship between the rotation of the Earth, the path of ocean current and air pressure centers. After studying maps of sea surface temperature and ocean...
Curated OER
Which Method Will You Choose? Finding Solutions to Systems of Equations.
Ninth graders investigate systems of linear equations. In this Algebra I lesson, 9th graders determine which method is the best for solving a systems: graphing, substitution, or elimination. Students choose a method and create a...
Curated OER
Canada and its Trading Partners
Students identify the relationship between Canada and its trading partners. They use two data sources, Canadian Statistics and E-STAT, on the Statistics Canada website to explore the growing importance of trade in general.
Curated OER
Internet Shopping Business Idea
Students create their own Internet business based on data they find concerning trends in Internet shopping. They discuss advantages and disadvantages to selling specific products and/or services over the Internet.
Curated OER
Healthy Water!?
Students test water for its quality and record their information.In this water quality activity, students investigate water for pH, macro invertebrates and identify its characteristics. Students complete worksheets on their data for...
Curated OER
What Are My Chances?
Students calculate probability. In this lesson on probability, students use given data to calculate to chances of a given event occurring. Many of the calculations in this lesson are applicable to daily life.
Curated OER
Osprey Journey
Students investigate the migration route of one bird, Osprey B4, using information gathered from satellites to track birds over a two-year period. They coimpare their graphs with maps of B4's migrations that have been plotted by...
Curated OER
Name That Tune: Matching Musical Tones Through Waveform Analysis
Pupils detect the waveform of musical notes to determine the code for the "safe" in this forensics simulation lesson. They use a microphone and tuning forks along with Vernier EasyData on their graphing calculator to analyze five musical...
Curated OER
ACC Basketball Statistics
Middle schoolers use math skills and create a spreadsheet. In this statistics and computer skills activity, students gather ACC basketball statistics, convert fractions to decimals and then percents. Middle schoolers use the gathered...
Curated OER
Angles Formed By Parallel Lines
Young scholars explore the concept of angles formed by parallel lines.They graph two parallel lines cut by a transversal, then measure the angles formed by the transversal and record the data in a table. Learners make conjectures about...
Curated OER
The Motivation for Movement
Young scholars explore the geographic theme of movement. In this migration lesson, students discuss push-pull factors that motivate immigrants and interpret illegal immigration data. Young scholars also discuss the difficulties that...
Curated OER
Mass Spectrometer
In this mass spectrometer worksheet, high schoolers read about how a mass spectrometer determines the elements in gases around Earth. Students answer 3 questions and identify the elements in a graph found by a mass spectrometer.
Curated OER
Mathematics Within: Bar And Pie Graphs
Students compare and contrast the use of bar and pie graphs with the same data. They create a data set by surveying all students in the class using sticky notes to make a table on the board. Then, each student creates a bar and pie graph...
Curated OER
It's a Drag!
Students create number lines using decimals and whole numbers. In this algebra lesson, students graph and solve linear equations. They plot ordered pairs on a coordinate plane correctly.
Curated OER
Invasion of the (Cactus) Booty Snatchers
Students, in groups of four,identify and analyze relationships among birds within a population, a community and an urban ecosystem. They fill out, while they're completing their experiments, a Populations of Birds Student Data Sheet.
Curated OER
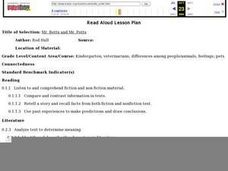
"Mr. Betts and Mr. Potts"
First graders listen to the book "Mr. Betts and Mr. Potts" and examine the career of being a veterinarian. They categorize animals based on whether they could be house pets or not, develop a class pet graph, and list the various...


