Hi, what do you want to do?
Texas Instruments
Texas Instruments: Describing One Variable Data
Students sort data and display it graphically using various plots. They also get familiarized with statistical concepts like measures of spread and central tendency.
Beacon Learning Center
Beacon Learning Center: How It All Stacks Up
The resource examines how to use bar graphs to organize and display data.
Beacon Learning Center
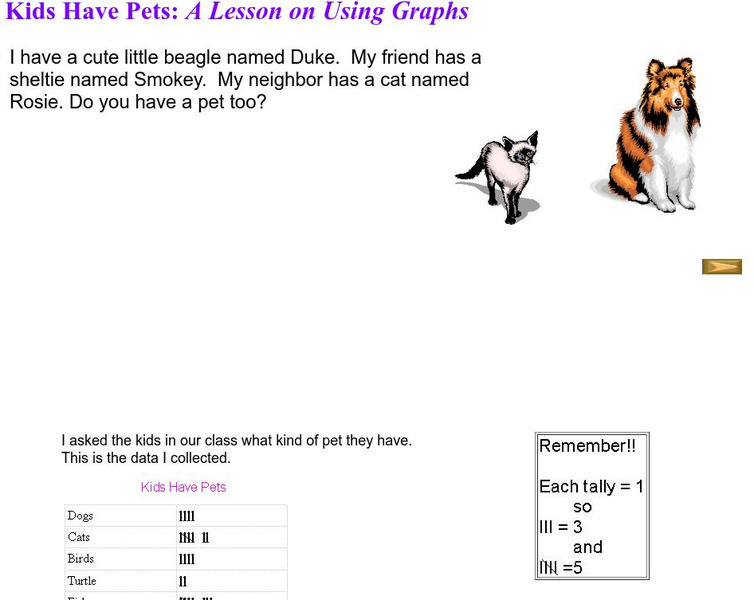
Beacon Learning Center: Kids Have Pets
The activity investigates bar graphs. Students complete a lesson using graphs to examine pets.
Beacon Learning Center
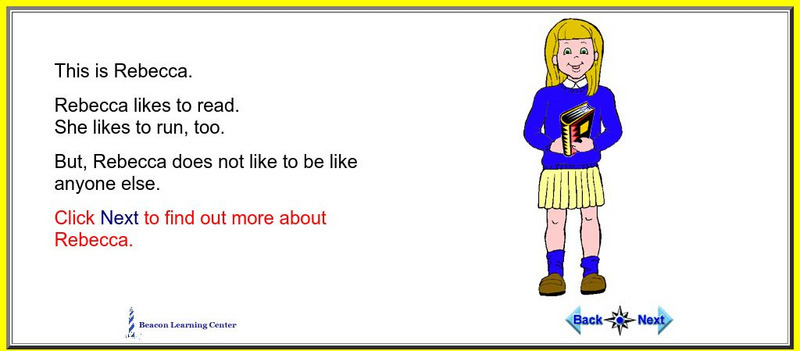
Beacon Learning Center: I Am Special
The activity investigates picture graphs. Learn about Rebecca through picture graphs.
Beacon Learning Center
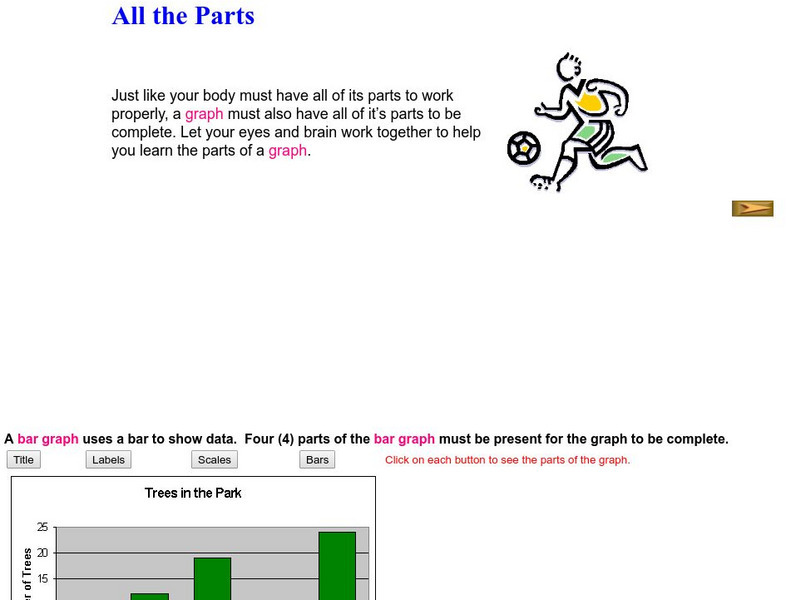
Beacon Learning Center: All the Parts
The activity investigates bar graphs. Students learn about all the parts of a graph.


