Curated OER
Means of Growth
Students collect and graph data. In this statistics lesson, students analyze their plotted data using a scatter plot. They identify lines as having positive, negative or no correlation.
Curated OER
Connecting Measurement
Students participate in activities the connect measurement to geometry, statistics, estimation, and the real world. They collect measurements from their elbow to the tip of their middle finger and make a box plot of the data as well as...
Curated OER
Forensics 101
Learners interpret how to communicate information and ideas in ways that are appropriate to the purpose and audience through spoken, written, and graphic means of expression. They use information-gathering techniques, analyze and...
Curated OER
How Do They Relate? Linear Relationship
Students collect information and use a line to represent it. In this algebra instructional activity, students investigate real world data to see if it makes a line. They graph the line comparing the relationship of the x axis with that...
Curated OER
And the Survey Says...
Learners use technology to input, retrieve, organize, manipulate, evaluate, and communicate information; apply appropriate technologies to critical thinking, creative expression, and decision-making skills. They collect and explore data...
Curated OER
Mathematical Models with Applications: What's Your Rate of Change?
Young scholars use regression methods available through technology to select the most appropriate model to describe collected data and use the model to interpret information. They use numeric techniques to write the equation of a line...
Curated OER
Dating Practices
High schoolers interpolate, extrapolate, and make predictions from given information. They present results and conclusions from given data using basic statistics. Pupils create a survey from a critical question and decide which sampling...
Curated OER
"it's All in the Cellar"
Seventh graders examine the process of constructing a site plan map at archaeological sites. They discuss the process of mapping techniques and calculation of percentages, create a plan site map of a cellar at Jamestown, and calculate...
Curated OER
3-D Beginning Graphs
Students explore the concept of big and small. They collect objects from the classroom, sort them by size, and create a graph using Duplo stacking blocks.
Curated OER
Water Meter Reader
Students examine a water bill from their household and examine it to find out how much water is used each month. They read their home water meters at the same time of the day for seven days and then construct a graph using their data.
Curated OER
Where You Belong
Learners identify different groups to which they belong, and use counting techniques to take a census of their family and class.
Shodor Education Foundation
Playing with Probability
Review basic probability concepts with your class using different-colored marbles in a bag. Then pair up learners and have them play a cool online interactive game in which they race miniature cars using the roll of a die or two. The...
Curated OER
Go The Distance Car Construction
Learners build and program a car to drive a specific challenge distance.They must at the end of the lesson, have the car that stops the closest to a challenge distance.
Achieve
Ground Beef
Ever wonder how a butcher creates the different types of ground beef? Young mathematicians explore the methods butchers use to create their desired ground beef quality. Given a combination of two types of meat with varying leanness,...
Curated OER
Make a Windmill
Learners explore Earth science by conducting an energy experiment in class. In this windmill lesson plan, students identify how wind has been used to pump water throughout history and the latest developments wind energy has produced....
Curated OER
Parachute Drop
Students explore the effects of gravity. They create a parachute and make predictions about the effect of adding weight to the bottom of the parachute. Students record and interpret results of parachute experiments.
Curated OER
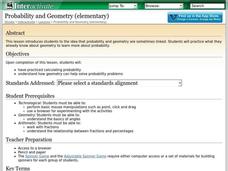
Probability and Geometry
Students examine the relationship between probability and geometry to solve problems. In this geometry and probability lesson, students investigate the effect of changing percentages on a spinner to the probability of landing on a...
Curated OER
How Far Did They Go?
Students create a map. In this direction and distance lesson, students come up with familiar places in the community and calculate the distances from these places to the school. Students create a map that displays these places and their...
Curated OER
What Do We Do With A Dirty Bomb?
Students examine composition of dirty bomb and its possible effects on a city, and investigate simulations of such an event; students use computational and problem solving skills to assess damage and prepare report proposing solution to...
Curated OER
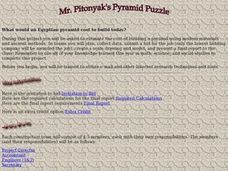
Mr. Pitonyak's Pyramid Puzzle
Students determine how much it would cost to build a pyramid using modern materials and ancient methods. They design scale drawings, models and submit final cost bids in an attempt to get the job of building a pyramid.
Curated OER
Mass Measurement
Middle schoolers explore geometry by completing a physics activity on-line. In this mass measurement lesson, pupils define the terms mass, volume, and density and identify their relationship with each other. They complete an on-line...
Curated OER
RCX Car Line Graph
Students develop a line graph based on distances that an RCX car drives in specified amounts of time. They then are given a specific amount of time for the car to drive and be asked to extrapolate the car's distance from the graph.
Curated OER
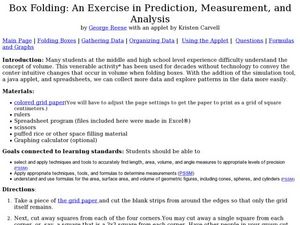
Box Folding: Predict, Analyze and Measure
Young scholars predict the shape of a geometric figure in 3D. In this geometry lesson, students construct 3D shapes to perfect their knowledge of measuring and predicting. This assignment is also available as an online interactive lesson.
Curated OER
Graphing Favorite Holidays
Students create spreadsheets and bar graphs based on results of survey of favorite holidays.


