Curated OER
Which Pizza
Seventh graders investigate the data related to finding the favorite type of pizza that 7th graders eat. The data is analyzed taken from a survey that focuses on the toppings of the pizza and not the brand. Students practice the sampling...
Curated OER
How to Construct and Conduct Successful Interviews
Students conduct surveys to gain statistical information. They examine the four main types of surveys and three types of samples. Students create a practice survey, conduct field studies, and create a survey for their hometown. Students...
Curated OER
Statistical Accuracy and Reliability
Ninth graders assess the accuracy and reliability of current survey data and how it is represented. They design a survey, collect data, and use technology to analyze the data and present the results. Students examine scatter plots and...
Curated OER
How Long? How Wide?
Second graders distinguish between and use nonstandard and standard units of measurement, use appropriate tools and techniques to measure length and width, and record and interpret data using graphs.
Curated OER
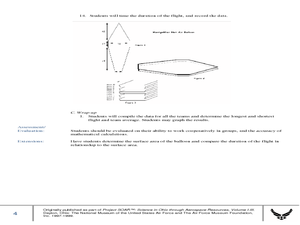
Up, Up and Away with the Montgolfier Balloon
Students construct hot air balloons. In this science lesson, students assemble their own balloon using tissue paper and glue. They time the duration of the flight, record data and calculate team averages.
Curated OER
Measurement, Perimeter and Area
Pupils explore the concept of measurement. In this measurement activity, students collect data about themselves such as height, finger length, neck circumference, foot length, and other body measurements. Pupils cut squares of certain...
Curated OER
Getting to the Point
Students determine location by using the technique of triangulation. They imagine that they are out in the wilderness and have come to the top of a ridge. How can one identify the ridge on the topo map? How can one figure out where you...
Curated OER
How to be a Great Navigator!
Students examine historical methods of navigation. They discuss the techniques of "Dead Reckoning," "Heaving the Log," and "Chip Log," pretend to sail from Europe to North America using vectors and determine the location of their...
Curated OER
A Study of a Quadratic Function
Students factor and solve quadratic equations. In this algebra lesson, students play a game as the collect and graph data. they identify properties of their parabola and make predictions.
Curated OER
Line of Best Fit
High schoolers explore the concept of linear regression. In this linear regression lesson, students do a Barbie bungee activity where they collect linear data. High schoolers plot their data using a scatter plot. Students determine a...
Curated OER
Black Hole Lesson
Tenth graders experiment with detection techniques for black holes by modeling the rotation of galaxies with larger and larger masses in the center. They discover while some events cannot be directly observed they may be observable in...
Curated OER
Box Plots on the TI-83 Calculator
Eighth graders research box plots on the Internet. They gather real life statistics and analyze the collected statistics by making multiple box plots on the TI-83 calculator.
Curated OER
Pop Clock
Students review the Census Bureau's Homepage, gather information regarding population trends in order to make predictions on future populations.
Curated OER
The Survey Says
Students experience the development of statistical data. In groups, they construct a survey questionnaire for a target audience. Students produce the questionnaire, distribute it, collect it, and tabulate the data. Using EXCEL, the...
Curated OER
Means of Growth
Students collect and graph data. In this statistics lesson, students analyze their plotted data using a scatter plot. They identify lines as having positive, negative or no correlation.
Curated OER
Connecting Measurement
Students participate in activities the connect measurement to geometry, statistics, estimation, and the real world. They collect measurements from their elbow to the tip of their middle finger and make a box plot of the data as well as...
Curated OER
Forensics 101
Learners interpret how to communicate information and ideas in ways that are appropriate to the purpose and audience through spoken, written, and graphic means of expression. They use information-gathering techniques, analyze and...
Curated OER
How Do They Relate? Linear Relationship
Students collect information and use a line to represent it. In this algebra instructional activity, students investigate real world data to see if it makes a line. They graph the line comparing the relationship of the x axis with that...
Curated OER
And the Survey Says...
Learners use technology to input, retrieve, organize, manipulate, evaluate, and communicate information; apply appropriate technologies to critical thinking, creative expression, and decision-making skills. They collect and explore data...
Curated OER
Mathematical Models with Applications: What's Your Rate of Change?
Young scholars use regression methods available through technology to select the most appropriate model to describe collected data and use the model to interpret information. They use numeric techniques to write the equation of a line...
Curated OER
Dating Practices
High schoolers interpolate, extrapolate, and make predictions from given information. They present results and conclusions from given data using basic statistics. Pupils create a survey from a critical question and decide which sampling...
Curated OER
"it's All in the Cellar"
Seventh graders examine the process of constructing a site plan map at archaeological sites. They discuss the process of mapping techniques and calculation of percentages, create a plan site map of a cellar at Jamestown, and calculate...
Curated OER
3-D Beginning Graphs
Students explore the concept of big and small. They collect objects from the classroom, sort them by size, and create a graph using Duplo stacking blocks.
Curated OER
Water Meter Reader
Students examine a water bill from their household and examine it to find out how much water is used each month. They read their home water meters at the same time of the day for seven days and then construct a graph using their data.


