University of South Florida
Fcat: Drops on a Penny: Teacher Notes
Students learn how to create stem-and-leaf diagrams and boxplots by collecting data on the surface tension of water molecules. This hands-on activity using pennies is a great way to learn how to organize data.
REMC Association of Michigan
Remc Association of Michigan: 21 Things4 Students: 13. Dig the Data
This tutorial contains ten quests. You will learn to create spreadsheets and charts, use formulas, and make decisions based on data. The first five quests has students plan a party and in the last five, they collect and analyze data for...
US Department of Education
Helping Your Child Learn Math: Math in the Home
An excellent compilation of activities that engage parents and children in math explorations at home. Detailed lessons covering a wide range of math topics such as fractions, measurements, money, data collection, and math in newspapers....
NASA
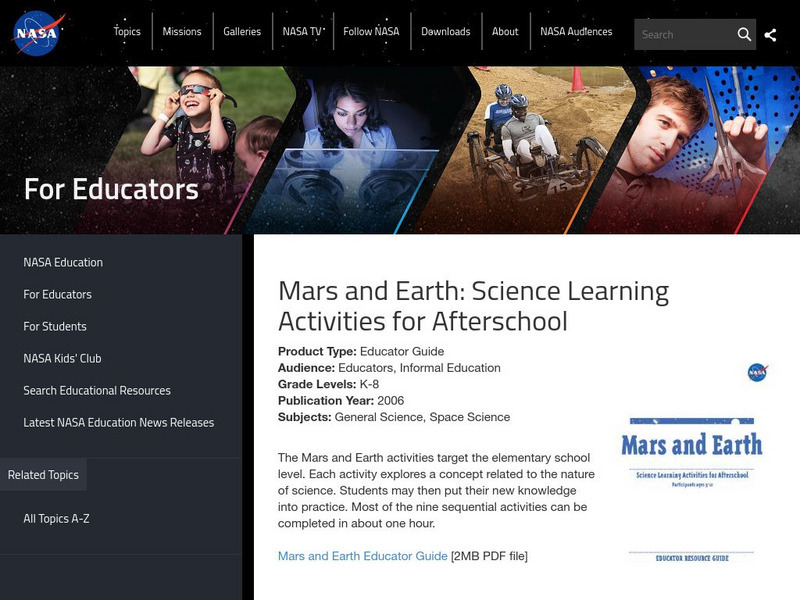
Nasa: Mars and Earth: Science Learning Activities for Afterschool
This set of activities teaches students about the big picture of science using Mars as an example: how to collect data, use evidence, and look at models.
Better Lesson
Better Lesson: Line Graph Activity
Data collected is represented in tables and the students will need to choose what they want to represent in their line graph.
US Department of Education
Helping Your Child Learn Math: Math at the Grocery Store
Make grocery shopping a mathematical experience. Parents and children explore a variety of math concepts through this collection of engaging math activities. Lesson are presented in varying levels of difficulty, offer "Parent Pointers"...
Rice University
Rice University: The Hand Squeeze
Students will enjoy this data collection and class analysis experiment involving the time it takes for a hand squeeze to travel around a circle of people. From organizing the activity to collecting the data to making a table and graphing...
CK-12 Foundation
Ck 12: Scientific Method (Basic)
[Free Registration/Login may be required to access all resource tools.] This is a basic introduction to the scientifice method that includes links to instructional videos, grade-level texts, interactive activities, and review materials.
Education Place
Houghton Mifflin: Eduplace: Make a Living Bar Graph
Student use simple data to line up in a living bar graph activity when they respond to simple questions in this lesson plan. They physically and visually represent the data. CCSS.Math.Content.3.MD.B.3 Draw a scaled picture graph and a...


