NOAA
Noaa: National Climatic Data Center: Groundhog Day
Find background about Groundhog Day and the folklore involved. Look through the charts that show how closely Punxsutawney Phil's predicitions align with the actual weather.
NOAA
Noaa: Be a Citizen Weather Reporter [Pdf]
Report the local weather to your community after deciding which data to collect and reading some of the National Weather Service's forecasting tips for amateur weather reporters.
Center for Innovation in Engineering and Science Education, Stevens Institute of Technology
Ciese Navigational Vectors
For this project, students use real time data to learn how pilots navigate when they fly. Students go through a series of lessons on vectors, weather maps and flight tracking, then take a pilot's test where they apply what they have...
PBS
Pbs Learning Media: Daily and Seasonal Weather: Interactive Lesson
Students investigate the relationship between daily weather and seasonal weather. Students will read about how weather data is collected, then interpret examples of weekly and monthly weather data to find seasonal patterns. Visual...
Scholastic
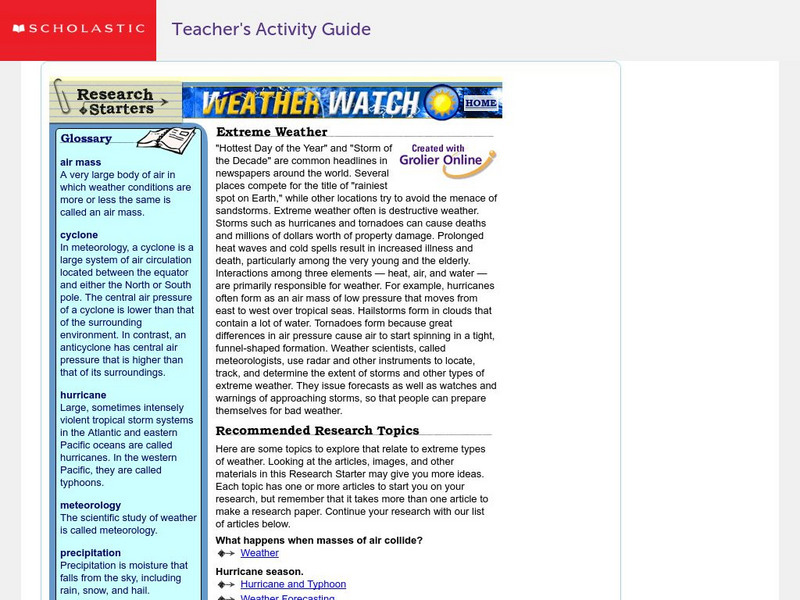
Scholastic: Extreme Weather
Begin your research on extreme weather conditions. View links to other weather related websites and articles.
NOAA
Noaa: Build Your Own Weather Station [Pdf]
Build six different instruments to collect meteorological data for the weather in your area.
NOAA
Noaa: Outflux: City Climate Comparisons
An interactive comparable climate data tool where the user chooses from a list of United States cities and several weather factors. The immediate result is a graph or graphs of historical US city data.
University Corporation for Atmospheric Research
Ucar: Differences Between Climate and Weather
In this activity, students collect weather data over several days or weeks, graph temperature data, and compare the temperature data collected with averaged climate data where they live.
Other
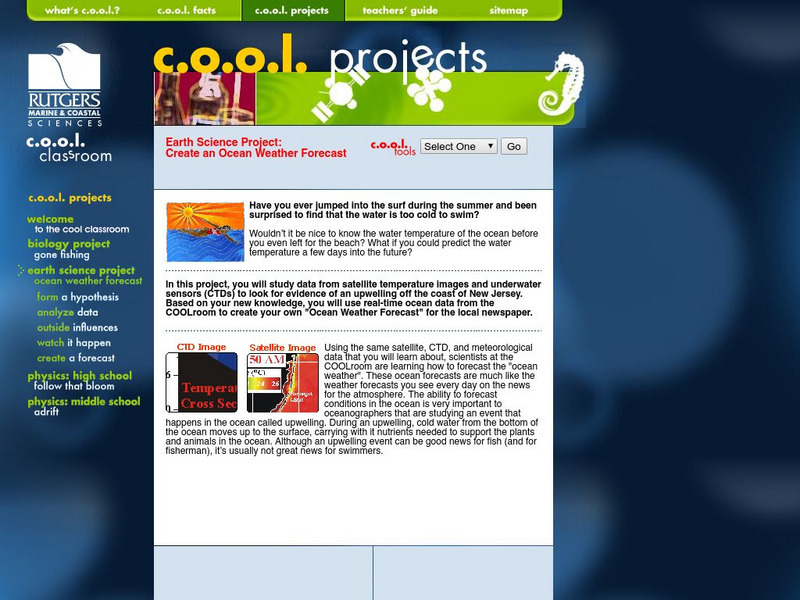
Rutgers: c.o.o.l. Class: Earth Science Project: Create an Ocean Weather Forecast
Want to learn how to forecast ocean weather? This c.o.o.l. project lists each of the steps in the scientific process, and has you work through each in this earth science based project.
Utah Education Network
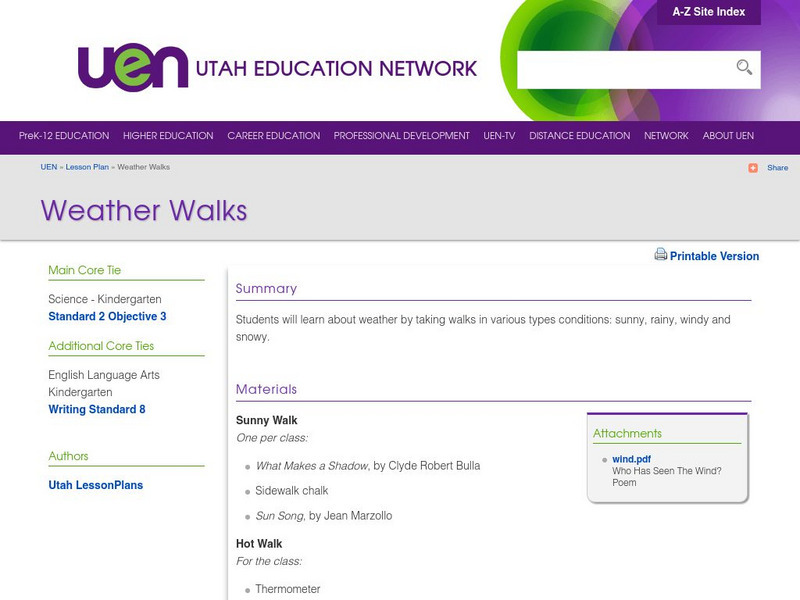
Uen: Weather Walks
In this multi-day, students will learn weather through multisensory approaches. Students will make daily predictions. After each daily prediction, they will collect measurement and observational data by taking walks in different types of...
University Corporation for Atmospheric Research
Ucar: Get the Picture Severe Weather
Students review graphs and charts of severe weather data then answer "True and False" questions about the content conveyed.
Utah Education Network
Uen: Trb 4:2 Investigation 8 Weather Forecasts
Learn how to predict and evaluate weather forecasts.
Other
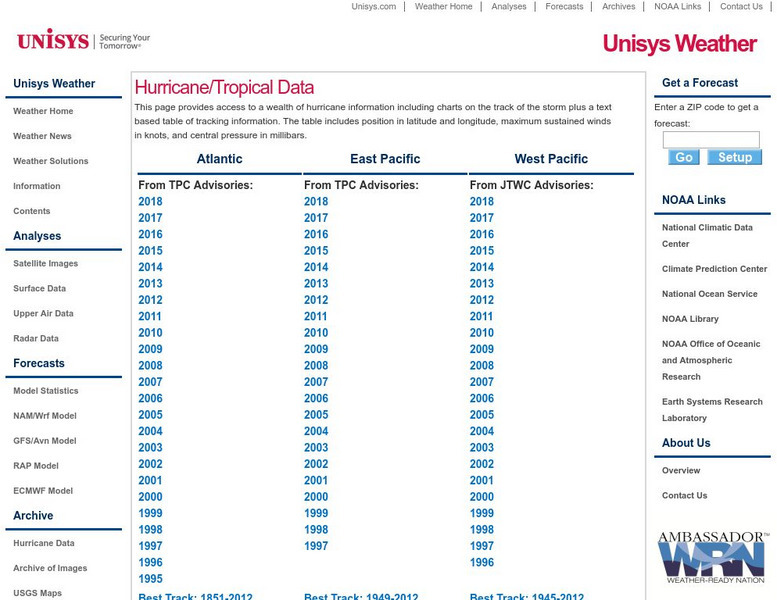
Unisys: Hurricanes/tropical Data
There is a table that has links to hurricanes in the Atlantic from 1995, East Pacific from 1997, West Pacific from 1996, South Pacific from 2000, and South India from 2000. This page has a satellite map and the Saffir-Simpson Scale.
University Corporation for Atmospheric Research
Ucar: Clouds, Weather, and Climate Teaching Box
This Teaching Box combines hands-on activities, data analysis, and discussion that help high school students consider how weather can affect cloud types and how cloud types can affect climate.
University of Wisconsin
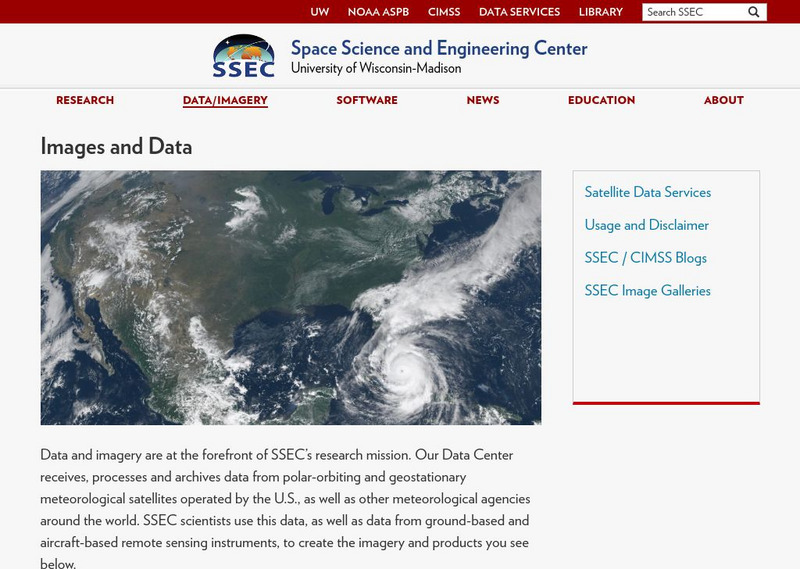
Ssec: Real Time Imagery and Data: Satellite Images of the Earth
Check out real-time satellite photos of the earth to study weather patterns.
Better Lesson
Better Lesson: Comparing the Weather
In order to meet Common Core standards, 2nd graders need to be able to interpret data to solve problems. This lesson provides practice in this area. Included in this lesson are a printable temperature chart and a video of second graders...
Other popular searches
- Weather Data
- Recording Weather Data
- Collecting Weather Data
- Weather Atmospheric Data
- Graphing Weather Data
- Analyzing Weather Data
- Collect Weather Data
- Math Data Graph Weather
- Weather Data Projects
- Gathering Weather Data
- Weather Log Data Sheets

![Noaa: Be a Citizen Weather Reporter [Pdf] Activity Noaa: Be a Citizen Weather Reporter [Pdf] Activity](https://static.lp.lexp.cloud/images/attachment_defaults/resource/large/FPO-knovation.png)

