Curated OER
Statistics and Graphing with Accelerated Math
Young scholars create charts and graphs, using a spreadsheet program, of their results from their accelerated math lessons. Students discover how graphs can be used to interpret data in our everyday lives as well as how several...
Curated OER
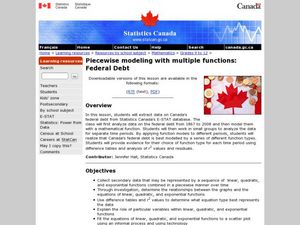
Piecewise Modeling with Multiple Functions: Federal Debt
Students analyze data on debt and write an equation. In this statistics lesson plan, students are given data from different time periods, and are asked to graph and analyze the data. They work in groups, and are assigned different parts...
Curated OER
Choosing the Best Graph
Eighth graders produce and examine two sets of data and create what they believe to be the most appropriate graphs to represent these sets of data. After completing the pre-assessment, they discuss reasons for using each type of graph...
Curated OER
Graphs Galore
Fourth graders conduct surveys to collect data. They analyze and interpret the data, then determine which type of graph is appropriate for the data. Students use the data to make predictions, discover patterns and draw conclusions...
Curated OER
Scientific Graphs
Learners organize data collected from their experiments using graphs. In this statistics and biology lesson, students organize their scientific data from an article into readable graphs. They define the usefulness of their graph and...
Curated OER
Variables and Patterns: Determining an appropriate scale while graphing
Sixth graders determine appropriate scales when graphing data. For this graphing lesson, 6th graders use an the applet "Graph It" to determine what is an appropriate scale for their data.
Curated OER
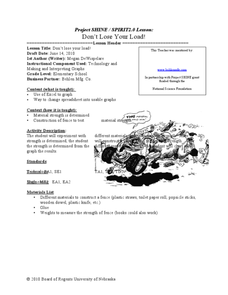
Don't Lose Your Load!
Students create graphs using collected data. In this algebra instructional activity, students use spreadsheet in Excel to create graphs to interpret their data and make predictions. They rewrite word problems using algebraic expressions.
Curated OER
What's Your Favorite? Survey And Graphing Project
Sixth graders create and edit spreadsheet documents using all data types, formulas and functions, and chart information. They collect and organize data that be portrayed in a graph that they create using EXCEL.
Curated OER
Creating and Reading a Pictograph
Second graders examine how data can be transferred into pictures on a pictograph. They analyze data on a graph about chewing gum, and create a pictograph that illustrates data about their preferences for the taste of bubble gum. ...
Curated OER
Statistics: Reading and interpreting production graphs
Students interpret and create different types of graphs. They analyze data from charts, develop a survey and design appropriate graphic illustrations and make a presentation.
Curated OER
Critter Encounter Chart
Students record data found at an assigned web site. For this data collection lesson, students access an assigned web site in order to complete a data chart about animals they see. They travel to different sections of the web site to find...
Curated OER
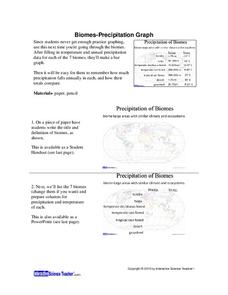
Biomes: Precipitation Graph
Students practice graphing by studying biomes. In this precipitation instructional activity, students graph the precipitation patterns for the 7 biomes on Earth. Students view a PowerPoint presentation in class which explores the 7...
Curated OER
Savings Planning Using Tables, Line Graphs and Early Proportionality
Students use proportional reasoning to make a chart of daily savings transactions and balances. In this accounting lesson, students read word problems and complete three handouts about a bidding and accounting problem. Students finish...
Curated OER
Survey Says...
Students practice taking surveys to answer different questions about radio. In this communications lesson, students brainstorm to create questions they can ask strangers about how often they listen to their radio. Students turn the...
Curated OER
Motion Musing
Students investigate graphing a line. In this algebra lesson, students collect data on the path of a skateboarder. They collect how fast the board is traveling along a straight line and graph their results.
Curated OER
Christmas Presents
Seventh graders create a graph of their Christmas gifts. They develop categories, compute fractional and decimal parts for each category, identify the number of degrees to represent each fractional part, and create a circle graph to...
Curated OER
A Thanksgiving Survey
Students conduct a survey. In this math lesson, students design and conduct a survey about Thanksgiving foods. Students display the collected data in a graph and use the graph to determine what food to serve for a Thanksgiving meal.
Curated OER
Math: Giant Alaskan Cabbages
Students analyze data from the Alaska State Fair's "Giant Cabbage Weigh-Off." Once they have sorted the weights, they calculate the range, mean, mode, and median of the cabbages. Finally, students create posters displaying their...
Curated OER
The Tortoise And The Hare
Students use the children's story of The Tortoise And The Hare in order to investigate the graphing of equations. The story is converted to an algebraic word problem for them to solve. Students investigate the relationships of data and...
Curated OER
Baseball Stats
Students explore data sheets and statistics in baseball. They use baseball data available on the Internet to develop an understanding of the different ways in which data can be analyzed.
Curated OER
What Can I Afford?
Students explore the concept of cell phone plans. In this cell phone plan lesson, students research the cost of cell phones. Students compare various cell phone plans and decide on which phone plan is best for them.
Curated OER
Graphing With RXTE
High schoolers use data from the Rossi X-ray Tiiming Explorer (RXTE) satellite to analyze and graph.
Curated OER
Graphing Data
Young scholars graph lines in a coordinate plane. In this geometry instructional activity, students graph lines on a coordinate plane, and identify the slope. They calculate the volume, area and perimeters of the shapes created on a...
Curated OER
Probability Using M&M's
Students estimate and then count the number of each color of M&M's in their bag. In this mathematics lesson, students find the experimental probability of selecting each color from the bag. Students create pictographs and bar graphs...
Other popular searches
- Graphs Interpreting Data
- Graphs and Data Display
- Continuous Data Graphs
- Circle Graph Data Set
- Extrapolation Graphs Data
- Graphs and Data
- Graphs and Data Handling
- Graphs Analyze Data
- Science Data and Graphs
- Pictorial Data Graphs
- Analze Data and Graphs
- Graphs Data Handling


