EngageNY
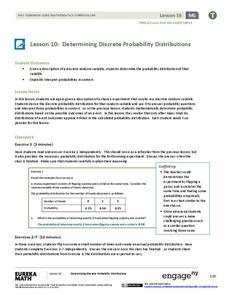
Determining Discrete Probability Distributions 2
Investigate how long-run outcomes approach the calculated probability distribution. The 10th installment of a 21-part module continues work on probability distributions from the previous lesson. They pool class data to see how conducting...
National Institute of Environmental Health Sciences
Lesson 1: Using the Pandemic Vulnerability Index Model to Examine the Risk Factors Associated with COVID-19
How vulnerable are you to COVID-19? High school mathematicians use the Pandemic Vulnerability Index to create models that help them collect and analyze data about the risk factors associated with COVID-19. After investigating four groups...
Curated OER
Elementary Statistics in Life
Students examine newspapers for graphs. They collect and sort data that is of interest to them. They enter data into a database and make comparisons using the information.
Curated OER
Application and Modeling of Standard Deviation
The first activity in this resource has learners computing the mean and standard deviation of two different data sets and drawing conclusions based on their results. The second activity has them using a dice-rolling simulation to...
Curated OER
Baseball Stats
Students explore data sheets and statistics in baseball. They use baseball data available on the Internet to develop an understanding of the different ways in which data can be analyzed.
Georgia Department of Education
The Basketball Star
Have learners use math to prove they are sports stars! Assess a pupil's ability to create and analyze data using a variety of graphs. The class will be motivated by the association of math and basketball data.
Curated OER
Mean and Standard Deviation
Get two activities with one lesson plan. The first lesson plan, is appropriate for grades 6-12 and takes about 20 minutes. It introduces the concept of measures of central tendency, primarily the mean, and discusses its uses as well as...
Curated OER
Is there Treasure in Trash?
More people, more garbage! Young environmentalists graph population growth against the amount of garbage generated per year and find a linear model that best fits the data. This is an older resource that could benefit from more recent...
Curated OER
How Long...?
Students explore measurement. They use appropriate units of measurement for different sized objects. Students collect their data and enter it into an Excel data base. They graph their findings and analyze their outcomes.
Curated OER
"who Lives in Your House?"
Fourth graders collect data about the people and animals living in their homes, and the students' shoe sizes. They work in groups to enter the information into a database from which they create graphs. They analyze the data to find the...
Curated OER
Height versus Shoe Size
Young scholars find a correlation between a person's height and his/her shoe size. They have access to entering data into lists on a graphing calculator and can complete scatter plots. Students read and interpret a scatter plot and use...
Curated OER
How's The Weather?
Students make a box and whiskers plot using the TI-73 graphing calculator. Each student would have their own calculator but they would work in small groups of two or three to help each other enter the data and make the plots.
Curated OER
Integration: Statistics, Measures of Central Tendency
Learners find the mean, median, and mode for each of four data sets. They are given two line plots, and compute the median and mode of the shown data. They find the median and mode for three stem and leaf plots. They solve two word...
Curated OER
Mean Absolute Deviation in Dot Plots
The lesson focuses on the ideas of dot plot representations and the mean absolute deviation of data sets.
Curated OER
Weather, Weather, Everywhere!
Sixth graders collect weather data to compare temperatures around the world. Using the Internet, learners collect data, put it into spreadsheets, and analyze and graph the results. An interesting way to cover the topic of weather.
Curated OER
Exponential Models
Students fit a continuous change exponential model to U.S. population data and use the model to predict future population.
Curated OER
Survey Says...
Young learners create and implement a school-wide survey about student body favorites! Learners record and analyze the data on a bar graph, picture graph, and line graph, and then display the data. Then, wrap it all up with a celebration...
Curated OER
Investigation - How Tall is the Average Sixth Grader?
Pupils will measure each other and record the data in inches. They will use a stem and leaf plot to display data and figure out the average height of the students in a class. The other statistical data will be collected like the mode and...
Curated OER
Counting
First graders explore collecting data. They collect data using a data collection sheet and enter the data into Excel. Students create graphs using Excel. They share their graphs with the class.
Curated OER
Patterns Here, There and Everywhere
Pattern recognition is a skill often used in mathematics. Learners count and sort manipulatives, organize the data into a graph and answer questions about the information displayed. They collect the objects to be used and create patterns...
Curated OER
Graphing Pendulum Results
Sixth graders set up a pendulum experiment deciding which variable to manipulate (length of string or weight on the string). They create a hypothesis, collect necessary equipment, and write out each step of their experiment. They then...
Curated OER
Integers in the Weather
Middle schoolers engage in a clever lesson that combines meteorology with mathematical thinking. They use integers in relation to high and low temperatures that they record. They use a spreadsheet of weather data, a computer, and gain...
Curated OER
I Wonder How Fast Manduca Grows Compared To Me
Students study the Manduca bug and its growth data. They look for patterns and compare their own growth rate to that of the Manduca.
Curated OER
Fun with Math using Magnetic Force
Sixth graders explore and discuss the effectiveness of magnets in different situations. For this math lesson, 6th graders discuss rate and graphs after exploring with magnets using different restrictions on the magnets. They analyze...
Other popular searches
- Data, Census, & Statistics
- Data Analysis Pictograph
- Data Table
- Categorical Data
- Data Analysis Lesson Plans
- Data Management
- Data Analysis Graphing
- Data Analysis and Graphs
- Science Fair Project Data
- Data Display
- Organizing Data
- Census Data


