Curated OER
Range, Cluster, Gap and Outliers
There are a number of activities here where learners collect and record data, as well as, activities where the likelihood of an event happening is calculated given the experimental probability. Young statisticians organize information...
Curated OER
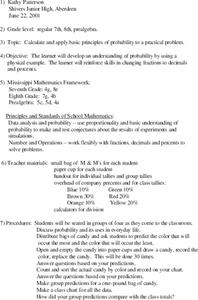
Probability using M & M's
Using M & M's candies, young statisticians predict the color distribution in a packet of candies and test their predictions against their group and the larger class. A review of converting between fractions, decimals, and percents...
Curated OER
Unit 5: Worksheet 5 - Estimation & Probability
In this estimation worksheet, students interpret given data and estimate fish populations. Students write a conclusion of their findings. Afterwards, they determine the probability of given events. This two-page worksheet contains...
Curated OER
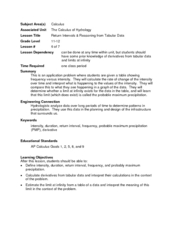
Return Intervals & Reasoning from Tabular Data
Students calculate derivatives from a set of data. For this calculus lesson, students estimate the limit at infinity. They complete a Return Interval handout at the end of the lesson.
Curated OER
The M & M Function
In this M & M worksheet, students perform probability experiments. They collect and interpret data, identify the exponential function describing the data and create graphs from the collected information. This one-page worksheet...
Curated OER
Data Analysis & Probability
Learners make predictions based on survey results. They calcuate sample proportions. Students estimate the number of voters in their district preferring the democratic candidate using their sample results. They review sample proportions...
Curated OER
Calculating Theoretical & Experimental Probability
Young scholars collect data by conducting a survey of fellow classmates. They investigate the relationship between estimates obtained from samples and theoretical probabilities. Answer keys included.
Curated OER
M&M Graphing and Probability
Learners sort, classify, and graph M & M's. They create pictographs and bar graphs with the colors and numbers in each bag of M & M's. They calculate the ratio and probability based on class results.
Curated OER
M&M Graphing
Youngsters sort M & M's by color. They graph the M&M's by color on a graph. This classic lesson is a wonderful way to introduce the concept and technique of graphing to young mathematicians. Pairs of kids can make up their own...
Curated OER
Business & Statistics: Final Exam
In this business and statistics worksheet, students read real-life business problems, arrange data, and identify the probability method best used to determine the answer. They identify the type of random sample, draw stem-and-leaf plots,...
Curated OER
Probability & Game Theory
Students explore the concept of probability. In this probability activity, students perform various probability experiments including flipping a coin, picking m&m's out of a bag, and the birthday problem.
Curated OER
Calculating Theoretical & Experimental Probability
Students explore the concept of experimental and theoretical probability. In this experimental and theoretical probability lesson, students collect data by conducting a survey of their classmates. Students compare their data and discuss...
Curated OER
Heads & Tails Data Collection
In this data collection worksheet, students use a penny and a dime to play a math game. Students flip the money in the cup and then record the number of heads and tails showing marking the coins in the box.
Curated OER
Probability Using M & M's
Pupils develop an understanding of probability by sorting bags of M & M's by color and recording the results in percents. The data is entered onto a spreasdsheet and graphed.
Curated OER
Line & Scatter (What Would You Use: Part 2)
Students discuss line graphs and scatter plots and the best situations in which to use them. Using the graphs, they determine the type of correlation between variables on a scatterplot. They create a scatterplot and line graph from a...
Curated OER
Applied Science - Built Environment Lab
Learners evaluate trash. In this Science lesson, students collect and weigh trash from their classrooms. Learners categorize the trash and the corresponding weights, recording the information on a data sheet.
Curated OER
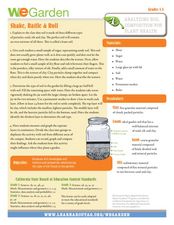
Shake, Rattle & Roll
Students examine soil. In this science instructional activity, students examine the layers of soil. Students collect soil from various locations and separate the layers. Students record and chart their findings.
Curated OER
The Regression Line and Correlation
Students investigate the best fit line through plotting on the TI. In this math activity, students examine their data representing regression lines and correlation. They use interactive technology to differentiate between linear and...


