Curated OER
Phenomenal Weather-Related Statistics
Eighth graders research, collect and interpret data about weather statistics. They record that data on spreadsheets. they create Powerpoint presentations on their individual or group research.
Curated OER
The Air Up There
Students engage in a lesson that is concerned with the average daily weather patterns. They collect data over a five day period and then write a summary of the observations made from it. Students record the mean and graph it on a simple...
Curated OER
Statistics - Central Tendency
In this statistics worksheet, students solve and complete 13 different problems that include creating various box-and-whisker plots. First, they write a definition for mean, median, mode and range. Then students explain how to determine...
Curated OER
Our Desert Backyard
Students make observations of their own backyard. In this environment lesson, students keep records of the plants and animals they see in their home or school yard. Students make notes of how the weather and environment changes over...
Curated OER
Teach it to me - Seasonal Calendar
Students document the weather. In this seasons lesson, students study the weather, record the temperature outside and photograph what the weather conditions look like. All information gathered by the students will be made into a book.
Curated OER
Can You Name the Four Seasons?
Students explore names, characteristics and traditions of the seasons and observe weather changes throughout the year.
Curated OER
The Fabled Maine Winter
Students graph and analyze scientific data. In this research lesson students use the Internet to obtain data then draw conclusions about what they found.
Curated OER
Time/Elapsed Time
Young mathematicians complete various activities to demonstrate proficiency in telling time and identifying elapsed time. They analyze and discuss television schedules, create a booklet about their daily activities, produce a TV. guide,...
Curated OER
Petro Products
In this petroleum products worksheet, students are given the components of crude oil and they graph the various products found in a 50 gallon barrel. Students complete an activity to determine if they have collected cards that represent...
Curated OER
Observing Fall Migrants
Students keep a detailed data collection log of the different types of monarch behavior. They track the weather conditions daily and link it to the migration of the monarchs. They summarize their data using either a graph or a computer...
Curated OER
Evidence of Change Near the Arctic Circle
Learners analyze graphs and make conclusions about climate change. In this climates lesson students produce graphs and identify relationships between parameters.
Curated OER
Cruise Conditions Graphing & Statistics
Students monitor weather conditions for an eighteen day period at a specific location. The temperature of both air and water is taken and the mean, median, and mode calculated. Differences between the highest and lowest recordings are made.
Curated OER
What's up with the weather?
Young scholars use the weather as a context for collecting data and making interpretations based upon the observations. The scientific method is also taught to give them a way to conduct the data collection.
Curated OER
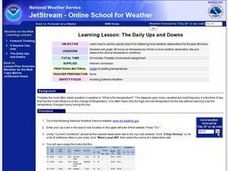
Learning Lesson: Ups and Downs
Students use the internet to find the air temperatures in their area. They create a graph based on the data. They analyze the data and examine tips for avoiding extreme weather.
Curated OER
Tracking Temperature
Students investigate the concept of temperature and how it has the tendency to fluctuate. They record the temperature as a class on a daily basis for a long period of time. The data is charted and then at a designated time students...
Curated OER
Lesson 3: Seven Day Road Trip
Students plan a seven day road trip. In this travel lesson, students plan a driving trip that includes five major cities or attractions in Florida or another state of their choice. They show the trip on a map, calculate distances that...
Curated OER
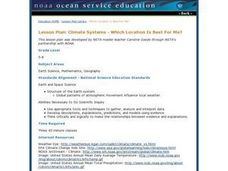
Climate Systems - Which Location Is Best For Me?
Students study the difference between weather and climate. In this climate systems lesson plan students search the Internet for the parts of the Earth's system, gather climate data and complete a challenge scenario.
Curated OER
Tracking Weather Over Time
Young scholars gather, analyze and interpret data. They explain scientific inquiry. They plot points on a map and report information from a spatial perspective.
Curated OER
Blowin' In The Wind
Students predict and hypothesize the reasons for wind movement. After viewing a video, they describe the effects of a high and low pressure system and what makes the wind blow. In groups, they construct instruments that measure air...
Curated OER
Comparing Temperature, Pressure, and Humidity
Students investigate data on temperature, pressure, and humidity by downloading information from the ARM Website. Working in groups, they discover how weather impacts life in each of the ARM sites. They record weather data in their...
Curated OER
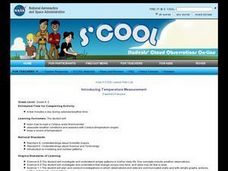
Introducing Temperature Measurement
Students explore temperature and use Celcius thermometers to measure and graph the temperature in the classroom daily. They estimate what they think the temperature might be and then find the actual temperature in the room.
Curated OER
Evaporation
First graders explore, analyze, document and study weather and the water cycle. They observe the weather and begin a weather journal. Each student interacts with the concepts of evaporation, condensation and precipitation, clouds,...
Curated OER
Using Non-Text Features
Second graders examine graphs and charts from their local newspaper. As a class, they discuss what the data means and how it relates to the article. In groups, they are shown two sets of graphs or charts and they practice explaining...
Curated OER
Believe It...Or Not
Students critically analyze data regarding climate changes using a glossary of terms generated by examination of climate related articles. They examine and graph climatic data, and discuss, hypothesize and test apparent discrepancies in...


