Radford University
Real World Data
Make math class feel more real by using real-world data. Scholars research or collect data on several different topics, such as nutrition, the motion of moving objects, cooling curves, and daylight hours. They create scatter plots using...
Radford University
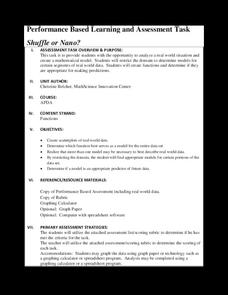
Shuffle or Nano?
Mix up your teaching playlist with a performance-based assessment task. Given iPod sales data for several years, scholars create a scatter plot and perform regression analysis. They determine the best fit curve for different domains.
Radford University
Temperature Math Activity
Warm up to a vacation-finding activity. After choosing a location for a vacation, pupils research the average monthly temperatures for the locality. They create scatter plots of the data and then determine the equations of the best-fit...
Radford University
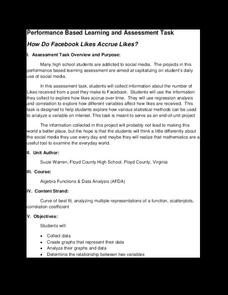
How Do Facebook Likes Accrue Likes?
Finally, a project pupils will instantly like! Young mathematicians collect data on the number of likes they receive for a social media post over time. During the first part of the project, they determine a curve of best fit and...
Radford University
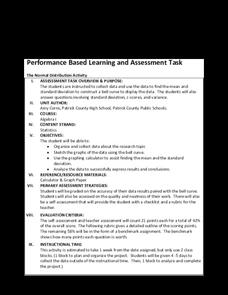
The Normal Distribution Activity
For whom does the bell fit? Pupils begin by working in groups gather data on three different variables. They then determine the mean and standard deviation of each data set and create bell curves. To finish, they answer guiding questions...
Curated OER
Get a Half Life!: Student Worksheet
Upper elementary or middle schoolers will explore non-linear functions, graphing, and the curve of best fit through real-life data collection and trial analysis. They explore the concept of half-life and radioactive decay using M&Ms,...
Curated OER
Mathematical Modeling
Study various types of mathematical models in this math lesson. Learners calculate the slope to determine the risk in a situation described. They respond to a number of questions and analyze their statistical data. Then, they determine...
Curated OER
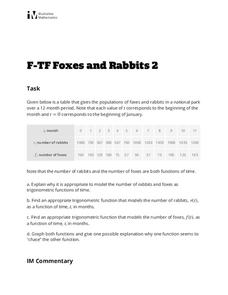
Foxes and Rabbits 2
Explore the relationship between the population of foxes and rabbits in a national park using trigonometric models. Plot data and find the appropriate trigonometric functions. Two questions require interpretation and explanation of...
It's About Time
Coal and Your Community
When I was young, I was afraid of the dark. Now I am afraid of getting the electric bill. This fourth lesson in a series of eight focuses on coal mining, conservation, and energy efficiency. Scholars start by taking data from a table and...
Curated OER
Women's World Cup Champs
The Learning Network in conjunction with the New York Times provides an article for reading and questions for short answers and discussion. If you are looking for a rainy day activity or just a time-filler this story titled, "Women's...
Curated OER
Get a Half Life!
Eighth graders use M&M's to experiment with data. They use a graphing calculator to determine the best equation for their data; linear, quadratic or exponential. They analyze the data to find the half-life of their M&M's.
Curated OER
Spaghetti Graphs
Students work in pairs to test the strength of spaghetti strands. They collect and graph data to determine a line of best fit. Students create a linear equation to interpret their data. Based on the data collected, students predict...
Curated OER
Collecting And Fitting Quadratic Data
Students investigate the concept of using quadratic data to plot coordinates on a plane. They also apply the quadratic formula for a variety of problems with the help of a graphing calculator to draw the parabola for given coordinates.
EngageNY
Analyzing Residuals (Part 2)
Learn about patterns in residual plots with an informative math lesson. Two examples make connections between the appearance of a residual plot and whether a linear model is the best model apparent. The problem set and exit ticket...
EngageNY
Modeling Riverbeds with Polynomials (part 2)
Examine the power of technology while modeling with polynomial functions. Using the website wolfram alpha, learners develop a polynomial function to model the shape of a riverbed. Ultimately, they determine the flow rate through the river.
EngageNY
Normal Distributions (part 2)
From z-scores to probability. Learners put together the concepts from the previous lessons to determine the probability of a given range of outcomes. They make predictions and interpret them in the context of the problem.
Curated OER
Why Are Hot Things Red?
In this radiation and temperature worksheet, students use 2 methods to derive the Wein Displacement law that shows the relationship between the temperature of a body to the frequency where the Planck curve's value is at its maximum....
Curated OER
Celsius to Fahrenheit
Students convert degrees between two different units. In this algebra instructional activity, students graph linear equations and identify the line of best fit. They use their line of best fit to make predictions given a set of data.
Curated OER
Linear and Exponential Models
Students linearize data to determine if an exponential model is suitable. For this linearizing data to determine if an exponential model is suitable lesson, students graph the residuals of sets of data that appear to have an exponential...
Curated OER
Quadratic Equations and Parabolas
Students graph and solve quadratic equations. For this functions lesson, students analyze a quadratic equation using three points on a curve to define the graph of a quadratic function. They find the vertex and intercepts of the graph.
Curated OER
Graphing and Analyzing
In this graphing and analyzing worksheet, 9th graders first state if each graph represents a linear or nonlinear relationship. Second, they create a difference table for each set of data presented and determine whether it represents a...
Mathematics Assessment Project
Sports Bag
Why not give surface area of cylinders a sporting chance in your classroom? A strategic problem-solving task requires pupils to consider the net of a cylinder. Individuals must determine the sizes of the pieces needed to make a sports...
Curated OER
The Regression Line and Correlation
Students investigate the best fit line through plotting on the TI. In this math instructional activity, students examine their data representing regression lines and correlation. They use interactive technology to differentiate between...
Curated OER
Tuned in: Tuning Forks and Sine waves
Students explore the characteristics of a pure sound wave produced by a tuning fork. They use sine waves to find a curve to fit the sound wave data produced by the tuning fork. A CBL and microphone is required for this activity.


