Curated OER
Frequency Distributions
In this statistics worksheet, students solve 5 frequency problems. In four of the problems, the frequency table is provided and students construct one relative frequency table, one cumulative frequency table, and two cumulative relative...
Mathed Up!
Cumulative Frequency and Box Plots
Learn how to display data. Young data analysts watch a video to review how to create cumulative frequency histograms and box plots. They work on a set of questions to practice producing these data displays.
Curated OER
Quartiles, Percentiles, and Cumulative Frequency
In this statistics lesson, 11th graders are asked to calculate the percentiles, quartiles and cumulative frequency given different graphs and data. There are 6 questions with an answer key.
Curated OER
Cumulative Frequency
In these word frequency worksheets, students choose a page from a newspaper and count the number of letters in each word and complete their results in a table. Students then calculate the mean number of letters. Students then collect...
Curated OER
Analyzing Graphs
In this statistics and probability worksheet, students analyze frequency distribution tables or histograms and box and whisker plots. The two page worksheet contains four multiple choice questions. Answers are included.
Curated OER
Working with Frequency Tables
For this Working with Frequency Tables worksheet, students analyze data that is organized in simple frequency charts. They calculate average from data presented in a frequency table, calculate a cumulative score, and identify data that...
Curated OER
Histograms and Frequency Tables
In this statistics worksheet, students solve and analyze graphs. They use histograms and frequency tables to solve their problems. There are 2 multiple choice questions with an answer key.
Curated OER
Organizing and Interpreting Data
In this organizing and interpreting data learning exercise, students solve and complete 10 different problems related to reading various data tables. First, they complete the 3 charts shown with the correct tally amount, frequency...
Curated OER
The Great Potato Hunt
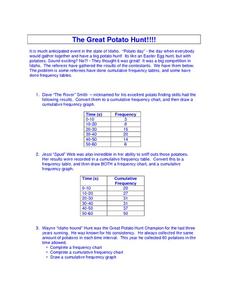
In this science activity, students examine the data from the potato hunt where potatoes are found like Easter Eggs. The data of the number of potatoes found is recorded in the frequency tables.
Bowland
Speed Cameras
Do speed cameras help reduce accidents? Scholars investigate this question using a series of spreadsheet activities. Along the way, they learn about randomness, probability, and statistical analysis.
Virginia Department of Education
Numbers in a Name
What's in a name? Pupils create a data set from the number of letters in the names of classmates. Each group then takes the data and creates a visual representation, such as a histogram, circle graph, stem-and-leaf plot, etc.
Curated OER
Integrated Algebra Practice: Histograms
In this histogram worksheet, high schoolers solve 6 multiple choice and short answer problems. Students read histograms and determine the frequency of a particular item.
Queensland Government
Means, Modes And Medians
Middle schoolers identify the mean, mode, and median of the heights for males and females who are age 13. They describe the difference between the three words and what each signifies. Finally, pupils fill in a table and calculate the...
Curated OER
Analyze and Interpret Statistical Information
In this probability and statistics learning exercise, 9th graders analyze and interpret histograms as they identify trends in the data. The two page learning exercise contains four problems. Answers are provided.
Curated OER
Probability Two Events
Students investigating the concept of probability practice the concept using a variety of different example problems. The lesson plan is delivered in a question and answer format. The frequency of answers is recorded in a data table for...
Curated OER
Integrated Algebra Practice: Box and Whisker Plots
In this box and whisker plot worksheet, students solve 5 short answer problems. Students use box and whisker plots to describe data and determine what percentile a piece of data belongs.


