Curated OER
African Wildlife
Students investigate the wildlife of Africa. In this animal science lesson, students view the video "National Geographic's African Wildlife" and visit websites to research additional information on the wildlife of Africa. Students...
Curated OER
Graphing at all Levels: It's a Beautiful Thing!
Mixing math and art is done in this lesson by applying graphing knowledge to create a unique piece of art. This lesson varies acording to the graphing knowledge of the artist. First, learners identify and review various types of graphing...
Curated OER
A Work Of Faith
Young scholars study about different types of religious art; they then select representative works from different faiths to create their own exhibit. They research a specific religious art tradition and create an exhibit of works of art...
Curated OER
Monoprint
Students review Gerald Ferstman's work and discuss abstract art. They design and create monoprints on Mylar. They reflect on their work and write about the experience of creating the piece.
Curated OER
Modern Marco Polos: Searching for China
Learners conduct Internet research to determine information about China's laws, government, philosophy, architecture, inventions, calendar and language. Students create a web site about ancient China and how it has influenced world history.
Curated OER
Searching the Net
Students create a Native American Nation flip book. In this Native American lesson, students choose one of four Native American Nations: The Iroquois, Hopi, Seminoles, Sioux. They research them on the Internet using teacher given...
Curated OER
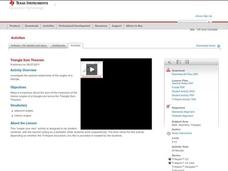
Triangle Sum Theorem
Teach your class how to solve problems using the triangle sum theorem. In this geometry instructional activity, students identify the missing angles in a triangle using the sum theorem. They graph triangles on the TI and moves the sides...
Curated OER
Tessellations with Regular Polygons
Show your learners how to create tessellations using different polygons. This is achieved by having students make observations of polygons to find the ones that will tessellate.
Curated OER
Sweating the Big Stuff
Students explore the responsibility of corporations in increasing global labor standards. They read case studies about sweatshops and create a list of human rights violations involved in a sweatshop.
Curated OER
Money Smart Choices
Students make choices regarding money management. In this personal finance lesson, students explore budgets, incomes, and expenses as they learn vocabulary regarding personal finance and consider how to create personal budgets.
Curated OER
Suspension Bridges: Connecting Lives
Students explore bridges. In this bridge lesson, students design and build a suspension bridge after visiting related websites and reviewing famous bridges in non-fiction books. Students follow the instructions from the...
Curated OER
Extension Activities Mr. Popper's Penguins
Learners read Mr. Popper's Penguins. In this Mr. Popper's Penguins lesson, students record descriptive clues from the book. Learners research Adelie penguins and compare and contrast to their local community. Students prepare...
Curated OER
Designing a Web Page
Students utilize educational software to create their own websites. In this web design lesson, students collaborate in groups to create web page designs based on workers and figures from their community. Students research...
Curated OER
Genome: A Tour and Genetic Disorder Brochure
Learners use the Internet to gather information about genetics, then research a genetic disorder. In this biology lesson, students listen to an interview with a geneticist, watch an animation of "chromosome coiling", then research and...
Curated OER
Wonderful World of Bats
Students create a book about bats. They write a letter to a scientist containing questions about bats. They compare the socialization of bats to humans; compare the needs of bats to humans and other animals.
Curated OER
Amazing Australia (Grade K)
Students listen as the teacher reads "Possum Magic" to them. They watch the movie of the book, and create a T graph illustrating the differences and similarities between the book and movie. They research an animal and print a picture in...
Curated OER
How Many Is Too Many?
Students explore the population explosion. They view a video depicting the exponential growth of human population. Students research the internet to project future population data. They perform hands-on, multimedia activities to study...
Texas Instruments
Light and Day
Pupils explore the concept of collecting data as they collect data on their graphing calculator about time, temperature, and light. Learners plot the data and create histograms and box and whisker plots to analyze the data.
Texas Instruments
Land Erosion - Running Off With Soil
Learners evaluate the relationship between rainfall and runoff of a small island for one year. In this rainfall vs. runoff lesson, learners analyze the relationship between the rainfall and the runoff on Barro Colorado Island over a...
Curated OER
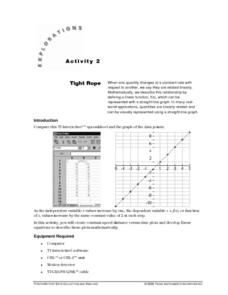
Tight Rope
Learn how to explore the concept of linear functions. In this linear functions lesson, students collect linear data from a motion detector. Students walk to create a linear function. Students plot the points on a graph...
Curated OER
NUMB3RS - Season 3 - "Provenance" - Set the Trap
Learners investigate concept of matrices through iteration in this probability lesson. They investigate probability by creating a lesson based on a famous painting. This assignment contains extensions to the...
Curated OER
Count Them Up
Pupils calculate area using the geoboard application on their calculators. They use a TI-73 calculator to find the areas of the shapes provided in the accompanying worksheet. Screen shots and instructions for creating shapes in the...
Curated OER
Journalism and Responsibility
Students explore the world of journalism. In this media awareness instructional activity, students investigate the roles and responsibilities of journalists. Students watch segments of videos and research websites to inform them prior to...
Curated OER
Corn-Crop is a Bin-Buster
Learners calculate percent change and create lists of data. They enter the corresponding bushels of corn measured in billions to their list and display, then convert the acres into scientific notation and use the value on the home screen...


