Curated OER
Energy Efficient Buildings
Seventh graders create plans for an energy efficient addition to the school. They work in small groups with each group having responsibility for examining one aspect of the problem. They create working diagrams and a model of their...
Curated OER
After the Garbage Can: Where Does Our Trash Go?
Students explore how waste disposal has changed over time and what the current issues are. In this disposal instructional activity students collect data and create graphs.
Curated OER
Properties of the Ocean: Change
Students research and create a visual presentation on the seasonal salinity of the Earth's oceans. They apply the research in a simulation of a lab disaster in which they must relabel ocean samples.
Curated OER
Statistics with State Names
Students analyze the number of times each letter in the alphabet is used in the names of the states. In this statistics instructional activity, students create a stem and leaf plot, box and whisker plot and a histogram to analyze their...
Curated OER
Conic Sections
Students explore the different properties of conics. In this algebra lesson, students calculate the midpoint of a line, the distances between two points as they get ready to find the focus and directrix in eclipse and other conics. They...
Curated OER
Some Similarities between the Spread of an Infectious Disease and Population Growth
If the infectious diseases and population growth worksheet, high schoolers simulate the spread of an infectious disease by exchanging fluids in a lab activity. Students watch the spread of the disease and graph the spread of the disease...
Curated OER
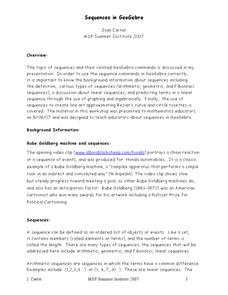
Sequences in Geogebra
Students follow detailed directions to use the GeoGebra program. In this mathematics lesson, students find the nth term of a sequence, and use line art to approximate a Bezier's curve. Students locate points and segments on a circle. The...
Curated OER
Rocket Angles
Eighth graders create rockets that be launched at varying angles to determine which angle is best to launch at for the longest distance.
Curated OER
What's the Fizz Factor
Students as a class create a fountain using both coke soda, and mentos candy. In this science lesson plan, students test which combination of coke and mentos products produce the tallest fountain. Students use the scientific method to...
Curated OER
Exploring Linear Equations
Eighth graders follow the teacher as they enter information into the graphing calculator. They investigate different graphs to explain the slope of a line, the y intercept, and parallel lines.
Curated OER
Ratios
Fourth graders complete a taste test of different sandwiches, rate them, and then put them in a ratio graph. For this ratio lesson plan, 4th graders write what they learned about ratios after this activity.
Curated OER
Spreadsheet Activity
Students create a spreadsheet to match a given sample. This includes adjusting column width and row height, changing alignment, changing size and style of print, changing number format.
Curated OER
Are You Coordinated?
First graders are introduced to a coordinate graph. They are given a graph and follow directions to place stickers in the designated blocks. They write coordinate points to identify the placement of their stickers.
Curated OER
Data Shuffle
Students find an advertisement or newspaper using charts or graphs. They create another graph using the same information in a different format. They write a comparison of the two graphs.
Curated OER
Lands That I Love
Students create a graph showing their family roots. They read about how immigrants can develop strong feelings for two countries. They discover the importance of their earliest memories.
Curated OER
Introduction to the Oscilloscope as a Voltmeter
Students measure the electric potential of 9 volt batteries using oscilloscopes. They draw a diagram of the front panel of the oscilloscope, conduct the experiment, and create a graph of voltage versus the number of batteries.
Curated OER
The World Population Explosion
High schoolers are introduced to some of the fundamental questions about the connections among population, resources and energy use, and environmental impacts. They explore population growth, interpret a line graph and calculate their...
Curated OER
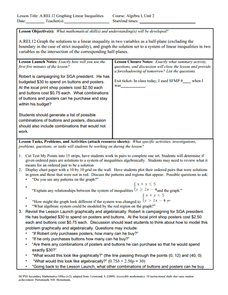
Graphing Linear Inequalities
Eighth graders extend skills for representing and solving linear equations to linear inequalities. Lesson activities build understanding and skill by plotting ordered pairs of numbers that either satisfy or do not satisfy a given...
Curated OER
Sun Path: Interactive On-line Mac or PC
Students use SunPath in the yearly mode to investigate seasonal changes in sunrise, sunset, length of day and sun altitude at their own latitude. Sun Path JAVA applet uses equations for a spherical Earth to calculate the sunrise and...
Curated OER
Student Created Murals
Students, over the course of an acedemic quarter, paint a mural on a wall in their school. They decide on a theme, measure wall space, design images, decide on the amount of paint they need, designate teams, schedules, etc.
Willow Tree
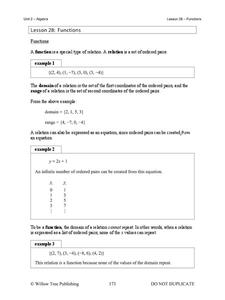
Functions
What makes a function a function? Learn the criteria for a relation defined as a function both numerically and graphically. Once young mathematicians define a function, they use function notation to evaluate it.
West Contra Costa Unified School District
Sneaking Up on Slope
Pupils determine the pattern in collinear points in order to determine the next point in a sequence. Using the definition of slope, they practice using the slope formula, and finish the activity with three different ways to...
EngageNY
End-of-Module Assessment Task: Grade 8 Module 4
Connect proportional linear equations and systems. The seven-question assessment is the last installment in a 33-part series. The items cover comparing proportional relationships, slope concepts, and simultaneous linear...
Statistics Education Web
NFL Quarterback Salaries
Use statistics to decide if NFL quarterbacks earn their salaries! Learners study correlation coefficients after using technology to calculate regression equations. Through the data, they learn the meaning of correlation and correlation...


