Curated OER
Creating Circle Graphs with Microsoft Excel
Seventh graders will learn how to construct circle graphs using paper and pencil. Then they will learn how to construct circle graphs using Microsoft Excel. This lesson uses technology and shows learners how to cross skills into the...
Curated OER
Wordle It
Pupils discuss, define, and give themselves character traits. In this character traits instructional activity, students create a list of ten character traits that describe themselves. Pupils create a data table and poll their classmates...
Curated OER
Common/Proper Nouns
Learners sort word card into two categories (common and proper nouns). They copy the class charts. Students create a table in Word including the headings, common noun and proper noun. They put the correct words onto their chart and add a...
Curated OER
Statistics Newscast in Math Class
Young scholars study sports teams, gather data about the teams, and create a newscast about their data. For this sports analysis lesson, students research two teams and define their statistical data. Young scholars compare the two teams,...
Curated OER
An Introduction to Sensors
Pupils list as many examples as they can of sensors in their homes and/or automobiles, define sensor and discuss what qualifies devices as sensors, explore human eyes as sensors while watching teacher demonstration, recognize that sensor...
Curated OER
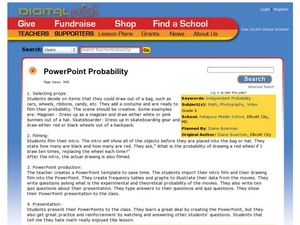
PowerPoint Probability
Sixth graders investigate film making by creating a video about probability. In this math visualization lesson plan, 6th graders create a presentation for their class demonstrating the probability of random events taking place in...
Curated OER
Surname Survey
Students use data from the U.S. Census Bureau to determine whether last names in a local phone directory reflect the Census Bureau's list of the most common surnames in the country. In this surnames lesson plan, students use the Internet...
Curated OER
How Do You Spend Your Time?
Students keep records and determine how much time they spend on certain activities. They insert the data into a spreadsheet. Students graphically display data in a bar graph and a circle graph.


