US Department of Education
National Center for Education Statistics: Create a Graph Tutorial
This tutorial walks students through how to create different types of graphs using the Create a Graph tool available on the website. Covers bar graphs, line graphs, pie charts, area graphs, scatter plots, and dependent and independent...
Cuemath
Cuemath: Frequency Distribution Table
A comprehensive guide for learning all about frequency distribution tables with definitions, how to create a frequency distribution table, and the formulas and graphs related to frequency distributions. With solved examples and...
University of Texas
Inside Mathematics: Parking Cars [Pdf]
This task challenges a student to use their understanding of scale to read and interpret data in a bar graph.
Scholastic
Scholastic: Bars, Lines, and Pies
Students will learn and reinforce skills for creating, applying and analyzing pie charts, bar graphs and line graphs.
University of Auckland School of Computer Science
Morris: Hash Tables
A description of hash tables and how they are created.
Microsoft
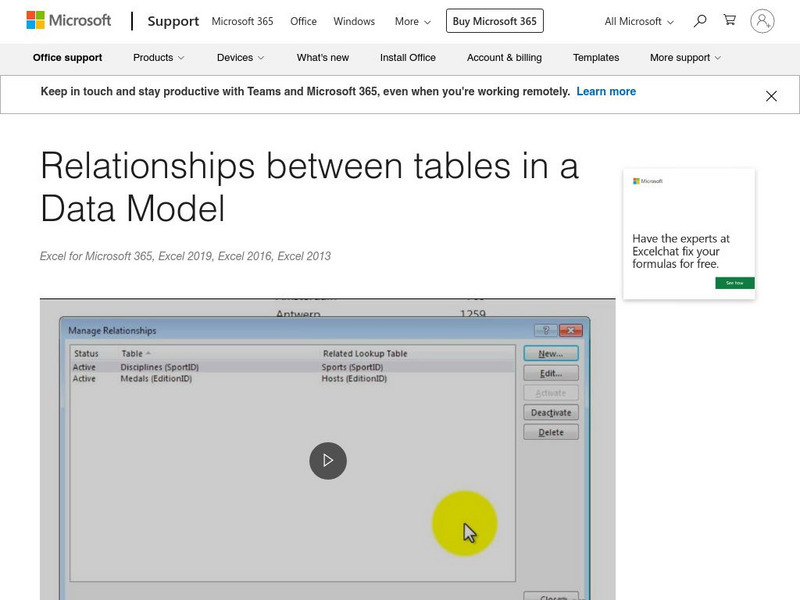
Microsoft: Relationships Between Tables in a Data Model
Add more power to your data analysis by creating relationships among different tables. A relationship is a connection between two tables that contain data: one column in each table is the basis for the relationship. To see why...
Science Buddies
Science Buddies: Data Analysis for Advanced Science Projects
The importance of data analysis in science projects is explained. Describes common mistakes young scientists make. The article then discusses how to find out what the standard methods of data analysis are for the type of research you...
Alabama Learning Exchange
Alex: Ice Cream Sundae Survey
Students quickly realize the importance of learning how to read and find information in charts, graphs, and tables compared to finding the same information written in a paragraph. This is a fun, high energy instructional activity!This...
Alabama Learning Exchange
Alex: Incline Plane and the Crashing Marble
Students will measure the effects of the height of an inclined plane on the force a marble produces to move a plastic, foam, or paper cup across a table. Students will discover that the higher the incline plane, the more force produced...
Annenberg Foundation
Annenberg Learner: The Habitable Planet: Ecology Lab
Create the parameters of your own ecosystem by choosing which producers and consumers live there. Visualize how the food web operates and species populations change. This simulator mimics the food web within a typical ecosystem and gives...


