US Department of Education
National Center for Education Statistics: Create a Graph Tutorial
This tutorial walks students through how to create different types of graphs using the Create a Graph tool available on the website. Covers bar graphs, line graphs, pie charts, area graphs, scatter plots, and dependent and independent...
University of Texas
Inside Mathematics: Parking Cars [Pdf]
This task challenges a student to use their understanding of scale to read and interpret data in a bar graph.
Scholastic
Scholastic: Bars, Lines, and Pies
Middle schoolers will learn and reinforce skills for creating, applying and analyzing pie charts, bar graphs and line graphs.
Microsoft
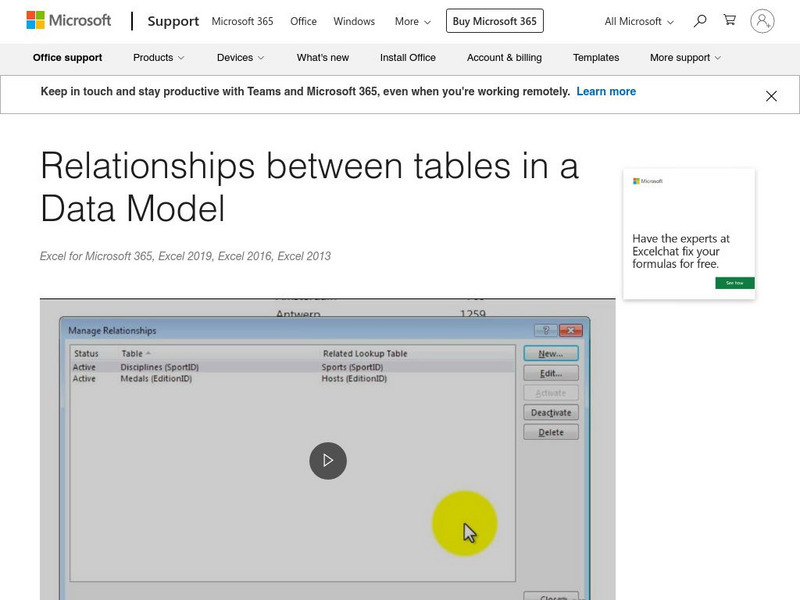
Microsoft: Relationships Between Tables in a Data Model
Add more power to your data analysis by creating relationships among different tables. A relationship is a connection between two tables that contain data: one column in each table is the basis for the relationship. To see why...
Alabama Learning Exchange
Alex: Representing Possibilities
The students will work through problems that will be represented in tables, equations, and graphs. This lesson was adapted from NCTM Student Math Notes, May/June 2007.This lesson plan was created as a result of the Girls Engaged in Math...
Alabama Learning Exchange
Alex: Incline Plane and the Crashing Marble
Students will measure the effects of the height of an inclined plane on the force a marble produces to move a plastic, foam, or paper cup across a table. Students will discover that the higher the incline plane, the more force produced...
Alabama Learning Exchange
Alex: My Peanut Butter Is Better Than Yours!
The students will engage in the process of statistical data comparing data using tables and scatterplots. The students will compare data using measures of center (mean and median) and measures of spread (range). This lesson can be done...

![Inside Mathematics: Parking Cars [Pdf] Lesson Plan Inside Mathematics: Parking Cars [Pdf] Lesson Plan](https://d15y2dacu3jp90.cloudfront.net/images/attachment_defaults/resource/large/FPO-knovation.png)


