Hi, what do you want to do?
Curated OER
Oobleck/Slime War
Students compare slime recipes. In this properties of matter lesson, students make Oobleck and glurch and compare the properties of each and examine the solid and liquid properties of them.
Curated OER
Lifestyles of an Olympic Hopeful
Students compare and contrast their lives with one other teenager in the United States (or another country!) who has aspirations of becoming an Olympic athlete. They address quality of life issues.
Curated OER
Algebra: Do You See What I See?
Students discover how to find the mean, median, and mode from sets of data. By using statistical techniques such as whisker plots and bar graphs, they display the data gleaned from problems. Individually, students complete projects...
Curated OER
How Do We Spend, Save, and Donate?: Penny Drive
Students explore the power of money. In this philanthropy lesson, students investigate how money is used in society. Students record data regarding money patterns on graphic organizers.
Curated OER
Search for the Missing Pi
Third graders work in groups of two to three with measuring tapes, finding the circumference and diameter of teacher-selected circular items. They relate circumference and diameter measurements to find pi.
Curated OER
Charlotte's Web
Fourth graders focus on fluency by reading the book Charlotte's Web. In this reading strategies lesson, 4th graders partner read, do guided reading, and independent reading to increase fluency. Students use Venn Diagrams, discuss...
Curated OER
Coin Probability
Fourth graders, in pairs, receive three different types of coin bags. They pick coins out of the bag and tally what was picked fifteen times. They do it with all three bags for three separate tallies.
US Department of Education
Nces: How to Create a Pie Chart
Resource from the National Center for Education Statistics provides tools and steps for creating printable pie charts online. Fill in the information, click the necessary buttons, and you have created a pie chart!
US Department of Education
National Center for Education Statistics: Create a Graph Tutorial
This tutorial walks students through how to create different types of graphs using the Create a Graph tool available on the website. Covers bar graphs, line graphs, pie charts, area graphs, scatter plots, and dependent and independent...
Beacon Learning Center
Beacon Learning Center: Piece of Pie
This is a tutorial for creating and practice interpreting pie charts. They use the example of number of people in each of 24 families to demonstrate how the pieces of pie are created. Then questions were asked and students input the...
Science Education Resource Center at Carleton College
Serc: Creating a Household Budget
In this Spreadsheets Across the Curriculum PowerPoint module, students create a household budget by tracking their expenditures over a month-long period. Students use Microsoft Excel to create a spreadsheet to track their own...
TeachEngineering
Teach Engineering: A Recipe for Air
Students use M&M's to create a pie graph that expresses their understanding of the composition of air. The students discuss why knowing this information is important to engineers.
US Department of Education
Nces: Create a Graph: Kids Zone
Make your own pie, bar, line, area or XY graph with this interactive tool. Look for examples of graphs already created from data collected by the National Center for Education Statistics. Complete with a graphing tutorial.
Better Lesson
Better Lesson: Circle Graph Activity
This lesson will allow the student to work through three stations. The stations will focus on creating and analyzing circle graphs. The young scholars will be using technology to create their graphs along with a hands-on activity using...
Texas Instruments
Texas Instruments: Exploring Probability
In this activity, students learn to create a categorical list, then convert their data into a pie chart, and use it to answer questions.
Varsity Tutors
Varsity Tutors: Hotmath: Practice Problems: Circle Graphs
Two problems present practice creating a circle graph from a data table. Both are given with each step to the solution cleverly revealed one at a time. You can work each step of the problem then click the "View Solution" button to check...
TeachEngineering
Teach Engineering: What's Air Got to Do With It?
Students are introduced to the concepts of air pollution and air quality. The three lesson parts focus on the prerequisites for understanding air pollution. First, students use M&Ms to create a pie graph that expresses their...
PBS
Wnet: Thirteen: Circle Graph Analysis and Creation
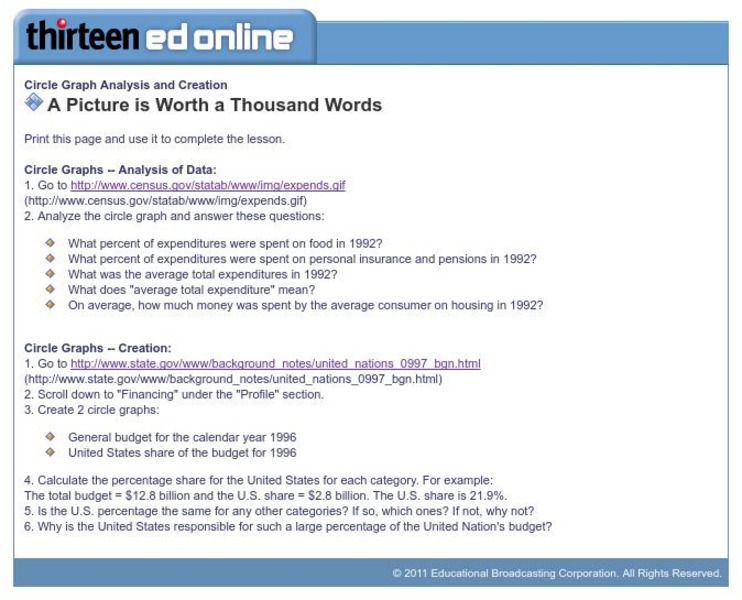
This site, which is provided for by WNET, gives a great way to practice using circle graphs through these exercises. One is analyzing a pie graph from the Census Bureau and the other creating pie charts using government data.
Math Is Fun
Math Is Fun: Data Graphs
Create and customize a bar graph, line graph, or pie chart based on a set of data and print it out.
The Franklin Institute
Frankin Institute Online: Group Graphing
This site from The Franklin Institute explores how to make a simple graph using a spreadsheet to portray survey data. It also gives a set of interesting sports-related web sites so that students can get statistical inforamtion.
Better Lesson
Better Lesson: Circle Graph Activity
This lesson will allow the student to work through three stations. The stations will focus on creating and analyzing circle graphs. The students will be using technology to create their graphs along with a hands on activity using M &...
Texas Instruments
Texas Instruments: Mc Dougal Littell Middle School Math: Making Data Displays
Students will create data displays using a scatter plot and a line graph of the data and a circle graph of survey data.


