Hi, what do you want to do?
Alabama Learning Exchange
Alex: Great Golly Graphs
This lesson plan asks middle schoolers to create a survey project including graphs, questions, tables, and data analysis. It gives an assessment and ideas for remediation and extension as well as ways to manage behavior problems and...
Better Lesson
Better Lesson: Class Surveys and Graphs
Students love graphing data that they "own". For this plan, the class will select a type of graph and create it using a class survey frequency table. Included in this lesson are videos of the class engaged in the lesson and samples of...
Shodor Education Foundation
Shodor Interactivate: Lesson: Bar Graph
This lesson plan is designed to give students practice creating and reading bar graphs as well as understanding how to accurately represent a graph with appropriate units.
Microsoft
Microsoft Education Lesson Plan: Candy Is Dandy
Explore color distribution of M&M candies using this detailed lesson plan. An engaging integrated lesson that requires understanding of spreadsheets and formulas, and logical reasoning. Links to related websites.
Alabama Learning Exchange
Alex: My Peanut Butter Is Better Than Yours!
The students will engage in the process of statistical data comparing data using tables and scatterplots. The students will compare data using measures of center (mean and median) and measures of spread (range). This lesson can be done...
Alabama Learning Exchange
Alex: Getting to Know Your Classmates Using Bar Graphs
Students will collect data from class using surveys. Students survey classmates concerning favorite movies, favorite color, shoe size, time spent studying, brand of cell phone and etc. From the data they will create bar graphs using an...
Alabama Learning Exchange
Alex: Who Bounces Best?
This is a cooperative learning, kinesthetic and presentation lesson. Students will use the computer to create graphs/charts to display data collected by counting the number of successful bounces when bouncing a basketball for 30 seconds....
Alabama Learning Exchange
Alex: Incline Plane and the Crashing Marble
Students will measure the effects of the height of an inclined plane on the force a marble produces to move a plastic, foam, or paper cup across a table. Students will discover that the higher the incline plane, the more force produced...
Science Education Resource Center at Carleton College
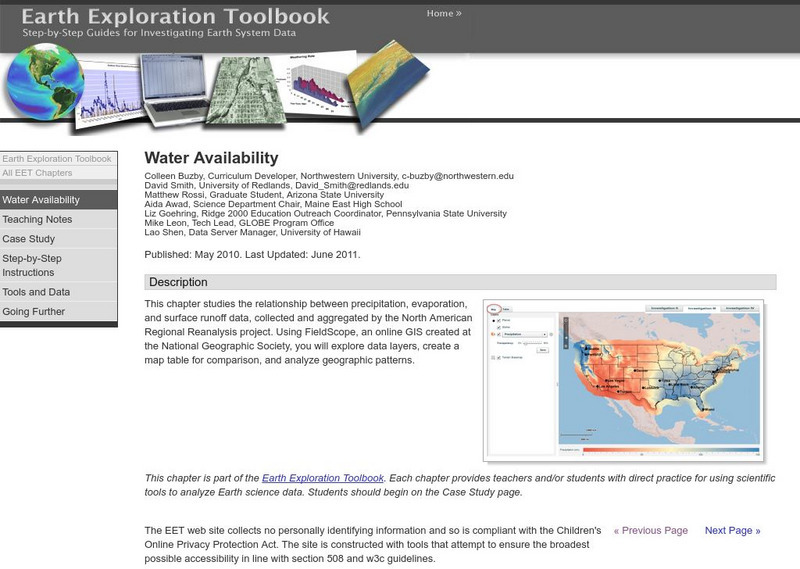
Serc: Water Availability
This instructional activity helps students discover the relationship between precipitation, evaporation, and surface runoff data. Using FieldScope, an online GIS created at the National Geographic Society, students will explore data...


