Hi, what do you want to do?
Curated OER
Charting Attendance Rate of Busch Gardens
Sixth graders, in groups, are given different parts of the whole project. They use information from Busch Gardens to explore line graphs, averages, and other math vocabulary.
Curated OER
Mapping the Ocean Floor
Students study the bottom structure of underwater habitats and how they can be mapped.
Curated OER
Best Guesser
Fifth graders develop strategies for estimating ages, and illustrate results by graphing and interpreting scatter plots to compare x and y coordinates.
Curated OER
Diurnal Temperature Changes and Water Vapor Content
Students determine how much moisture in the air affects the diurnal temperature range. They investigate to determine the different climatological regimes of both the Southern Plains and the world. and greenhouse gases effect the earth's...
Curated OER
Altitude and Flight Forces
High schoolers use the World Wide Web to access and use FoilSim. They also use the World Wide Web to access the NASA Glenn Web site for information relative to the factors involved with the flight of an airplane.
Curated OER
Olympic records through time
Students compare the records of gold medal Olympic winners for the last 100 years and decide if we are faster, stronger than in the past.
Curated OER
High School Mathematics Problems from Alaska: Tourist and Traveler Information
Students work with monetary exchange rates and the metric system as they simulate working to help tourists travel through Canada to Alaska.
Curated OER
Planet Research
Students recognize that the other eight known planets, which revolve around the Sun, have characteristics and surface conditions that are different from Earth; and identify examples of those differences.
Curated OER
Tracking Sunrise and Sunset
Students collect, record, and graph the sunrise and sunset times. They explain how the relationship between the tilt of Earth's axis and its yearly orbit around the sun produces the seasons.
Curated OER
Home on the Biome
Fifth graders study six major biomes, graph temperature and rainfall, and present their findings to the class.
Curated OER
Finding the Salt Front
Students discuss definitions of estuary, salinity, and the salt front. They listen as the teacher explains the Hudson River Miles and ways the upriver and downriver sections relate to the north and south. Students graph the salt front...
Curated OER
Career Exploration
Fifth graders identify areas of careers that coincide with their individual interests.
Curated OER
Metal Composition & the U.S. Mint
Students study the meaning, symbolism, and value of U.S. coins,
especially the quarter. Theyresearch why in 1965 the U.S. Mint decided to
change the metal composition of the quarter to copper coated with nickel.
In addition, they perform...
Curated OER
Cubic Volume
Fifth graders record measurements and calculate the volume. They select and use appropriate units and procedures to measure volume # use tools such as technology to solve problems
Curated OER
Fun With Graphs
First graders read about making graphs and lean how to make graphs using "The Graph Club" software.
Curated OER
The Diary of Anne Frank: Research Project on Concentration Camps during World War II
Eighth graders investigate the Holocaust and the persecution of specific ethnic groups in Europe during World War II.
Curated OER
Lewis and Clark Encounters with Native Americans
Students research what the exchange was between the various Native American groups and Lewis and Clark. They are able to write reflections after truly considering the issue with the help of research.
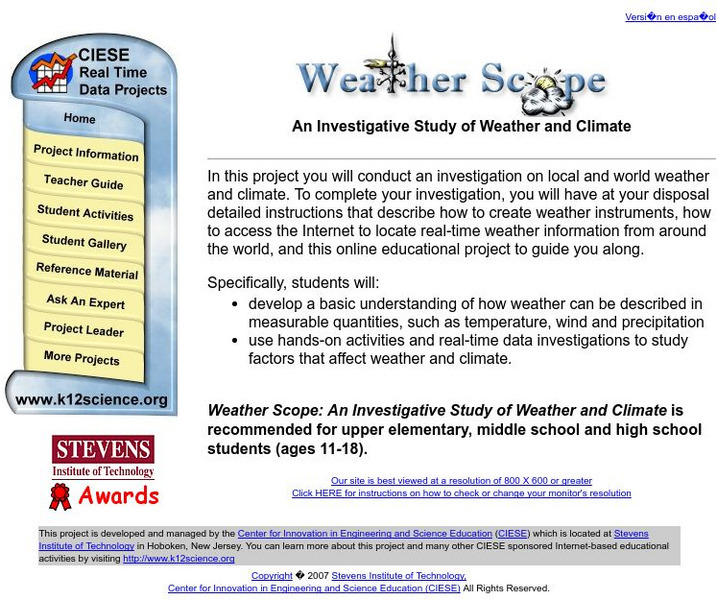
Center for Innovation in Engineering and Science Education, Stevens Institute of Technology
Ciese Real Time Data Projects: Weather Scope: A Study of Weather and Climate
Use real-time data to study factors that affect weather and climate, create weather instruments, and share data with students around the world.
Science Education Resource Center at Carleton College
Serc: Mn Step: Statistical Analysis of Lincoln
For this activity, students first work in groups to collect information about a set of pennies. They measure and record the mass for each one in a table using a spreadsheet program if possible. They also record its year and, for 1982...
University of Texas
Inside Mathematics: Parking Cars [Pdf]
This task challenges a student to use their understanding of scale to read and interpret data in a bar graph.
Other
Laus Dnet: Grade 5 Excel Lesson Plan
In this online lesson, students will survey students in their school to determine their favorite type of hand-held ice cream. Before performing the survey, students will make predictions about which ice creams they think will be the...
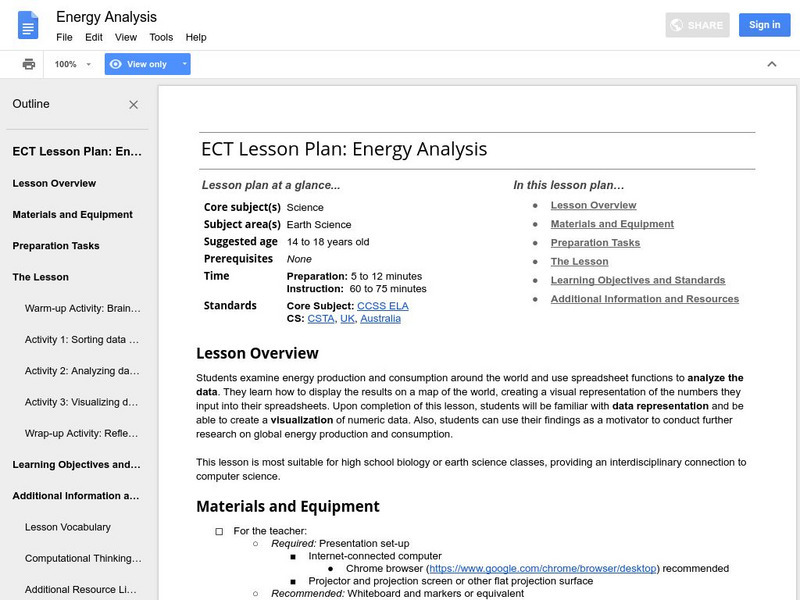
Google
Google for Education: Energy Analysis
Students collect data on energy production and consumption around the world. They input the data into a spreadsheet and use spreadsheet functions to analyze it. Finally, they upload the data into a fusion table to create a visualization.
Science Education Resource Center at Carleton College
Serc: Investigating Motion Graphing Speed
In this introduction to motion activity, learners will get a personal understanding of speed and acceleration by experiencing it firsthand. Wheeled office chairs or other cart like devices are used to give one student a ride as a fellow...
Better Lesson
Better Lesson: Going for the Gold
Second graders read and create graphs based on Olympic data for 2014.


![Inside Mathematics: Parking Cars [Pdf] Lesson Plan Inside Mathematics: Parking Cars [Pdf] Lesson Plan](https://static.lp.lexp.cloud/images/attachment_defaults/resource/large/FPO-knovation.png)


