101 Questions
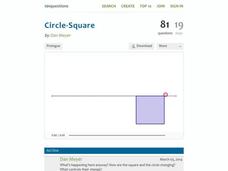
Circle-Square
How do the area and perimeters of circles and squares compare? A clever video illustrates the change in the area of a circle and square while their total perimeter stays the same. The task is for learners to predict the point where the...
Teach Engineering
Start Networking!
Class members create their own social networks by collecting signatures before graphing the interactions with their fellow classmates. The degree distribution of the simulated social network is determined by calculating the degree of...
5280 Math
Pythagorean Triples
From Pythagorean triples to the unit circle. Learners use the Pythagorean Theorem to find Pythagorean triples and then relate their work to the unit circle in a fun algebra project. Their discovery that x^2+y^2 is always equal to one on...
Point Pleasant Beach School District
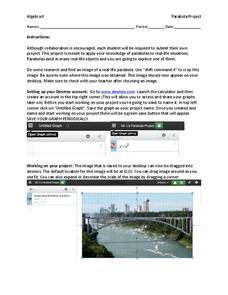
Parabola Project
Class members select a picture that contains a parabola and construct a drawing of it using function graphs in the quadratic project. Individuals restrict the domains of the functions to create a more accurate drawing. They then submit a...
101 Questions
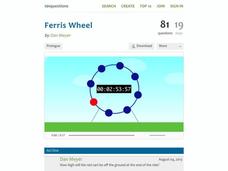
Ferris Wheel
Around and around you'll go! Learners analyze the periodic nature of a Ferris wheel. Using a trigonometric function, they make predictions about the location of a specific car at the end of the ride and its total trips around the circle.
Curated OER
Math Games for Skills and Concepts
A 27-page packet full of math games and activities builds on algebra, measurement, geometry, fractional, and graphing skills. Young mathematicians participate in math games collaboratively, promoting teamwork and skills practice.
Varsity Tutors
Varsity Tutors: Hotmath: Practice Problems: Circle Graphs
Two problems present practice creating a circle graph from a data table. Both are given with each step to the solution cleverly revealed one at a time. You can work each step of the problem then click the "View Solution" button to check...
Texas Instruments
Texas Instruments: Grandparents and Special Friends Day
This lesson was designed for our Grandparents and Special Friends day. It can be used for any visitation day, or an open house. The lesson is designed to review percent of a whole and the sector of the circle representing the percentage....
Texas Instruments
Texas Instruments: Math Today the Next Frontier for Flight
This activity provides students the opportunity to gain experience in creating circle graphs on the calculator and provides an excellent real-world review of computation with percents.
University of Vienna (Austria)
The Graphs of Sin, Cos, and Tan Maths Online
This applet allows the user to create the graphs of sin, cos, and tan by moving a scroll bar. The user can watch the unit circle and the graph simultaneously to see how the two are related. The user may also choose to see the angle...
Texas Instruments
Texas Instruments: Mc Dougal Littell Middle School Math: Making Data Displays
Students will create data displays using a scatter plot and a line graph of the data and a circle graph of survey data.
Texas Instruments
Texas Instruments: Picturing Probabilities of Number Cube Sums
Students use ideas of ratio and proportion to investigate various ways to make a circle graph. Students create graphs to display the probabilities of the different sums that can be generated with two number cubes. [Requires Adobe Reader.]
US Department of Education
Nces: How to Create a Pie Chart
Resource from the National Center for Education Statistics provides tools and steps for creating printable pie charts online. Fill in the information, click the necessary buttons, and you have created a pie chart!
Oswego City School District
Regents Exam Prep Center: Practice With Organizing and Interpreting Data
Several problems are presented to test your skills in creating and interpreting frequency tables, pie charts, box-and-whisker and stem-and-leaf plots.
Shodor Education Foundation
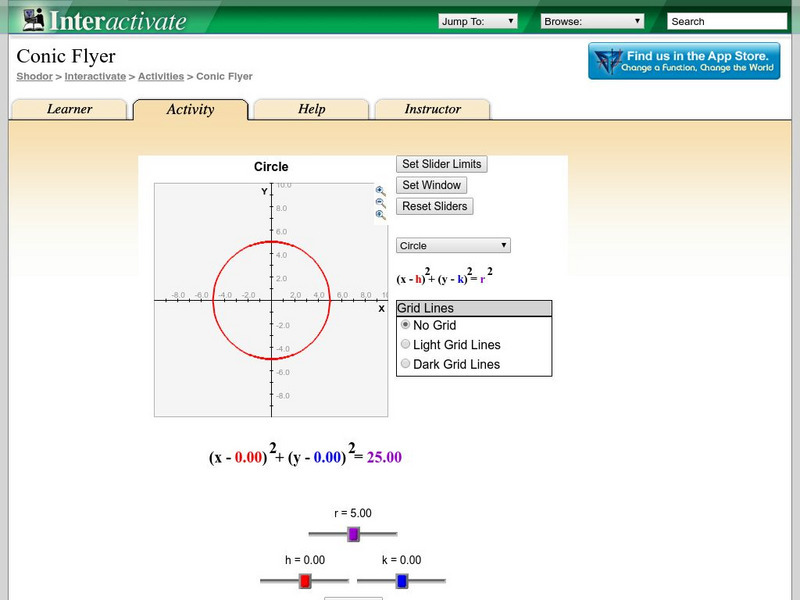
Shodor Interactivate: Conic Flyer
"This applet allows the user to create graphs of conic sections. Using slider bars, one can manipulate the function to change the constant values and view the effects of those changes."
Rice University
Rice University: The Hand Squeeze
Students will enjoy this data collection and class analysis experiment involving the time it takes for a hand squeeze to travel around a circle of people. From organizing the activity to collecting the data to making a table and graphing...
Texas Instruments
Texas Instruments: Titanic Tales
In this activity, students interpret data tables and graphs. They find percentages, and create circle graphs to display data.
