Curated OER
Graphing Parabolas and Circles
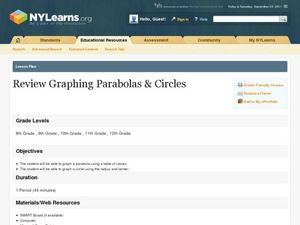
Students graph parabolas and circles. In this algebra lesson, students create a table of values and graph the coordinate pairs to create a graph. They graph a circle using the radius and center.
Curated OER
Growing Circles
Pupils identify the equation to represent a circle. In this algebra lesson, students review properties of conics and how they are related. they use a robot to create a visual of circles and their application to the real world.
Curated OER
Fractions, Decimals, and Percents
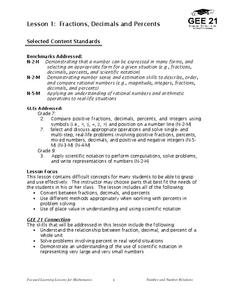
Learners connect different mathematical concepts. They create a circle graph. Students then create a question in which they collect data in order to convert fractions to decimals and decimals to percents.
Curated OER
The Unit Circle
Students solve problems using the unit circle. For this precalculus lesson, students identify angles using the properties of the unit circle. They observe the trigonometric graphs and sine, cosine and tangent.
Curated OER
Statistical Inquiry
In this statistical inquiry worksheet, students analyze and interpret a variety of diagrams such as a scatter plot, bar graph and pie charts. They create tables and other diagrams to support given data. This two-page worksheet contains 3...
Curated OER
Graphs - On the Floor and Ask a Friend
Students create a floor graph and then interview their classmates to create their own graph.
Curated OER
Twelve Days of Christmas
Students create charts and graphs using a spreadsheet. They chart the number of each gift given day by day from the song, "The Twelve Days of Christmas." They create a bar graph and a circle graph from their data on the spreadsheet.
Curated OER
Creating a Graph
Students brainstorm favorite things to do during the summer. They survey classmates to collect data, arrange it in a chart, and create graphs using ClarisWorks.
Curated OER
The Numbers Tell the Story
Students demonstrate how to gather and interpret statistical data. In this data analysis instructional activity, students search for statistics on the health effects of smoking and place the information into charts. Students create these...
Curated OER
Discovering Mitosis in Onion Roots
Students discover the different stages of mitosis by examining onion roots under a microscope, drawing diagrams of what they see, and organizing collected data in a chart and create a pie graph from their lab data.
Curated OER
Circle Relationships
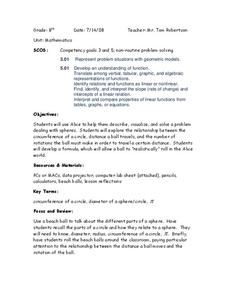
Students explore circles. In this geometry lesson, students explore the relationship between the circumference of a circle, the distance a ball travels, and the number of rotations the ball must make in order to travel a certain...
Curated OER
Discovering Pi
Define terminology related to a circle. Practice accuracy in measuring and then create a spreadsheet based on data collected from solving for parts of a circle. Groups can have fun analyzing their data as it relates to Pi.
Point Pleasant Beach School District
Parabola Project
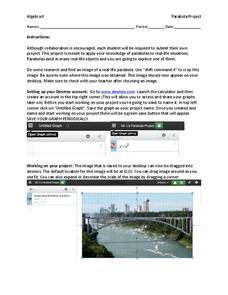
Class members select a picture that contains a parabola and construct a drawing of it using function graphs in the quadratic project. Individuals restrict the domains of the functions to create a more accurate drawing. They then submit a...
West Contra Costa Unified School District
Solving Systems of Inequalities
Don't throw away those transparency sheets just yet! Young scholars first review inequalities on a number line, then learn about graphing inequalities in the coordinate plane. Finally, they use overhead transparencies to create systems...
EngageNY
Ferris Wheels—Using Trigonometric Functions to Model Cyclical Behavior
Have class members going in circles as they model the path of a Ferris Wheel using trigonometric functions. Building on the previous lesson plan in this series on transformations, learners use trigonometric functions to model wheels...
Virginia Department of Education
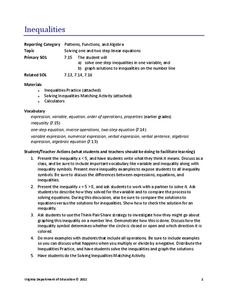
Inequalities
Not all resources are created equal — and your class benefits! Scholars learn how to solve one-step inequalities using inverse operations. They complete an activity matching inequalities to their solutions.
Mathematics Assessment Project
Middle School Mathematics Test 3
Real-life mathematics is not as simple as repeating a set of steps; pupils must mentally go through a process to come to their conclusions. Teach learners to read, analyze, and create a plan for solving a problem situation. The...
CK-12 Foundation
Algebraic Functions: Vertical Line Test
To be (a function) or not to be (a function). An easy-to-use interactive has pupils drag a vertical line onto several graphs to determine if they represent functions. Some challenge questions assess understanding of this idea.
Curated OER
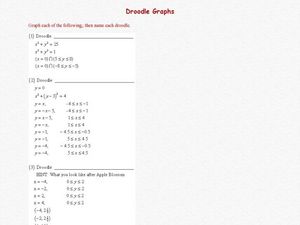
Droodle Graphs
In this algebra worksheet, students graph piecewise functions, and circles using restrictions. They graph a line and chop it on both ends to create a stair case looking graph or a ladder. There are 3 involve questions with an answer key.
Curated OER
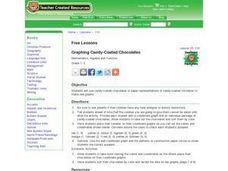
Graphing Candy-Coated Chocolates
Students place pieces of candy on their coordinate graphs as the teacher calls out the colors and coordinates embedded in the plan. The teacher circulates around the class to check each student's answers for accuracy.
Curated OER
Time Management: Piece of Pie
Learners examine their own lives and how well they manage their time outside of school. In this this time management instructional activity, students discover the amount of time they spend on other activities, and create a pie chart with...
Curated OER
What's Playing Tonight?
Students collect data and visually represent it. They conduct a survey of favorite movies. Using a spreadsheet, students organize the data and create bar and circle graphs. Students answer statistical questions regarding the data.
Curated OER
Using Averages to Create Graphs Through Excel
Sixth graders create and use a spreadsheet to make graphs which will be used to analyze Progress Report and Final Report Card grades. They practice finding the mean, median, mode, and range of a data set. Students also incorporate column...
Curated OER
Graphing Fun
First graders analyze objects and make a graphing picture to analyze the data. In this graphing lesson, 1st graders complete an object graph assessment, a picture graph assessment, and a bar graph assessment to analyze their given objects.
