University of Vienna (Austria)
The Graphs of Sin, Cos, and Tan Maths Online
This applet allows the user to create the graphs of sin, cos, and tan by moving a scroll bar. The user can watch the unit circle and the graph simultaneously to see how the two are related. The user may also choose to see the angle...
PBS
Pbs: The Lowdown: Exploring Changing Obesity Rates Through Ratios and Graphs
In these KQED Lowdown infographics, explore how adult obesity rates in the United States, as measured by body mass index (BMI), have dramatically changed in the past half-century. A circular graph and a pictograph depict data by decade,...
Alabama Learning Exchange
Alex: Let's Make a Pie
The students will survey their classmates and construct circle graphs to display their results. Students will produce circle graphs using a compass and protractor, and then with an interactive computer program.This lesson plan was...
Texas Instruments
Texas Instruments: Mc Dougal Littell Middle School Math: Making Data Displays
Students will create data displays using a scatter plot and a line graph of the data and a circle graph of survey data.
Texas Instruments
Texas Instruments: Picturing Probabilities of Number Cube Sums
Students use ideas of ratio and proportion to investigate various ways to make a circle graph. Students create graphs to display the probabilities of the different sums that can be generated with two number cubes. [Requires Adobe Reader.]
US Department of Education
Nces: How to Create a Pie Chart
Resource from the National Center for Education Statistics provides tools and steps for creating printable pie charts online. Fill in the information, click the necessary buttons, and you have created a pie chart!
Oswego City School District
Regents Exam Prep Center: Practice With Organizing and Interpreting Data
Several problems are presented to test your skills in creating and interpreting frequency tables, pie charts, box-and-whisker and stem-and-leaf plots.
Alabama Learning Exchange
Alex: Get on Your Mark, Get Set, Go!
In collaborative/cooperative groups, students will review basic vocabulary and concepts for data and statistics. Students will create, collect, display, and interpret data in the form of frequency tables, bar graphs and circle graphs.
Shodor Education Foundation
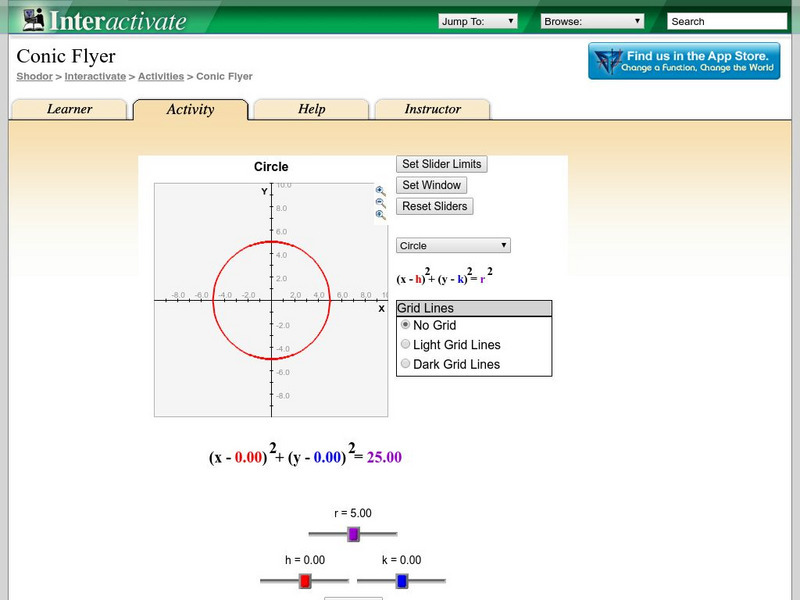
Shodor Interactivate: Conic Flyer
"This applet allows the user to create graphs of conic sections. Using slider bars, one can manipulate the function to change the constant values and view the effects of those changes."
Rice University
Rice University: The Hand Squeeze
Students will enjoy this data collection and class analysis experiment involving the time it takes for a hand squeeze to travel around a circle of people. From organizing the activity to collecting the data to making a table and graphing...
Texas Instruments
Texas Instruments: Titanic Tales
In this activity, students interpret data tables and graphs. They find percentages, and create circle graphs to display data.
Other
Laus Dnet: Grade 5 Excel Lesson Plan
In this online instructional activity, young scholars will survey students in their school to determine their favorite type of hand-held ice cream. Before performing the survey, young scholars will make predictions about which ice creams...
Other
Ctte: Geometer's Sketch Pad Activities
This site offers numerous activities for middle school and high school students to explore using Geometer's Sketch Pad.


