Curated OER
Exploring Area/Perimeter Through Coordinate Geometry
Students explore area and perimeter through coordinate geometry using student literature, hands-on manipulatives, and the Internet.
Curated OER
Potential and Kinetic Energy
Sixth graders explore potential and kinetic energy. In this science lesson, 6th graders assume the role of a roller coaster engineer and design a roller coaster. Students use their knowledge of kinetic and potential energy to design a...
Curated OER
All About Me
Students answer short answer questions, state their likes and dislikes, say what roles they have, and more about themselves. In this all about me lesson plan, students read books about how we are all different and the same.
Curated OER
Up From The Roots
Students review prefixes and root words then complete a Root Words worksheet. An answer sheet is provided with the instructional activity.
Curated OER
Putting it all Together
Students take notes and summarize information. In this communication instructional activity, students summarize information by taking notes using the various methods that their instructor presents to them.
Curated OER
Soil Permeability
Students participate in a lab activity in which they examine the permeability of different soils. They examine the soil's composition and make predictions about the permeability of the soils. They share their observations to the class.
Curated OER
Scientific Inquiry: Periodic Motion
Students construct their own pendulum. In this physics lesson, students design an experiment to find the factors affecting its period. They formulate a conclusion based on experimental data.
Curated OER
A Bird's Eye View of our 50 States
Third graders focus on state birds as they learned absolute location (latitude/longitude) of each state, as well as their relative location (bordering states).
Curated OER
Coin Probability
Fourth graders, in pairs, receive three different types of coin bags. They pick coins out of the bag and tally what was picked fifteen times. They do it with all three bags for three separate tallies.
Curated OER
Investigation of Timbre
Students design an experiment to analyze the timbre of different instruments. In this physics instructional activity, students analyze the missing quality in sound. They discuss their results in class.
Curated OER
Chessboard Challenge
Second graders read "The King's Chessboard" by David Birch. The teacher reads the story aloud and pauses at several points for students to calculate the next number in a pattern of doubling.
Curated OER
1Word and Letter Match Puzzle
In this word and letter match activity, students match groups of 3 letters to words that contain each set. A reference web site is given for additional activities.
Better Lesson
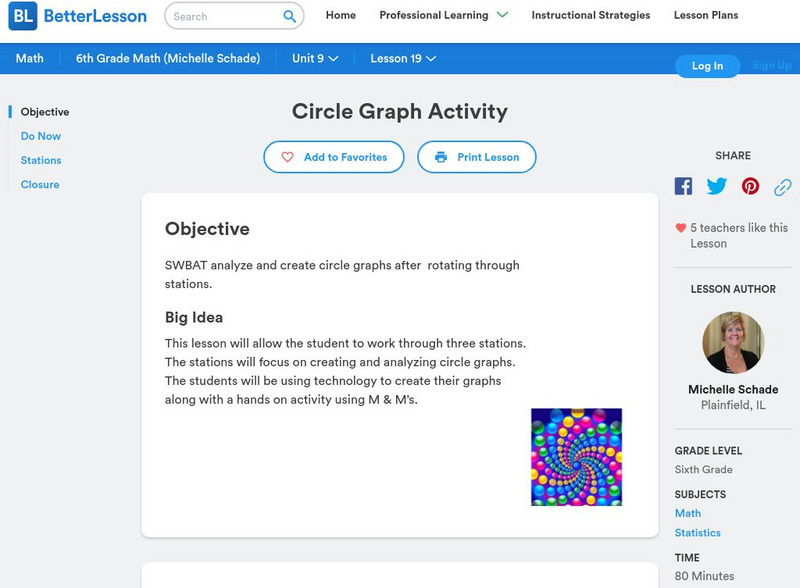
Better Lesson: Circle Graph Activity
This lesson will allow the student to work through three stations. The stations will focus on creating and analyzing circle graphs. The students will be using technology to create their graphs along with a hands-on activity using M&M's.
Better Lesson
Better Lesson: Circle Graph Activity
This lesson plan will allow the student to work through three stations. The stations will focus on creating and analyzing circle graphs. The students will be using technology to create their graphs along with a hands on activity using M...
Varsity Tutors
Varsity Tutors: Hotmath: Practice Problems: Circle Graphs
Two problems present practice creating a circle graph from a data table. Both are given with each step to the solution cleverly revealed one at a time. You can work each step of the problem then click the "View Solution" button to check...
CK-12 Foundation
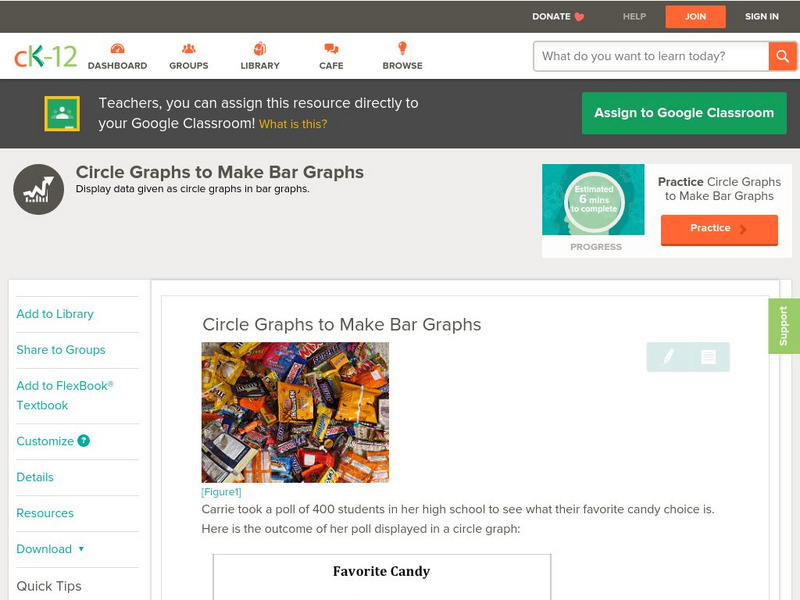
Ck 12: Statistics: Circle Graphs to Make Bar Graphs
[Free Registration/Login may be required to access all resource tools.] Create a bar graph using data displayed in a circle graph.
Better Lesson
Better Lesson: Analyzing and Creating Circle Graphs
Sixth graders will be learning through exploration on how to analyze and create circle graphs and Venn diagrams.
Math Graphs
Houghton Mifflin: Math Graphs: Percents and Circle Graphs 1 [Pdf]
Students calculate the percent of the total income for sources of income and expenses. Learners then use this information to create a circle graph. The handout is available in PDF format.
Math Graphs
Houghton Mifflin: Math Graphs: Percents and Circle Graphs 2 [Pdf]
Students calculate the percent of the total expenses for sources of income and expenses. Learners then use this information to create a circle graph. The handout is available in PDF format.
PBS
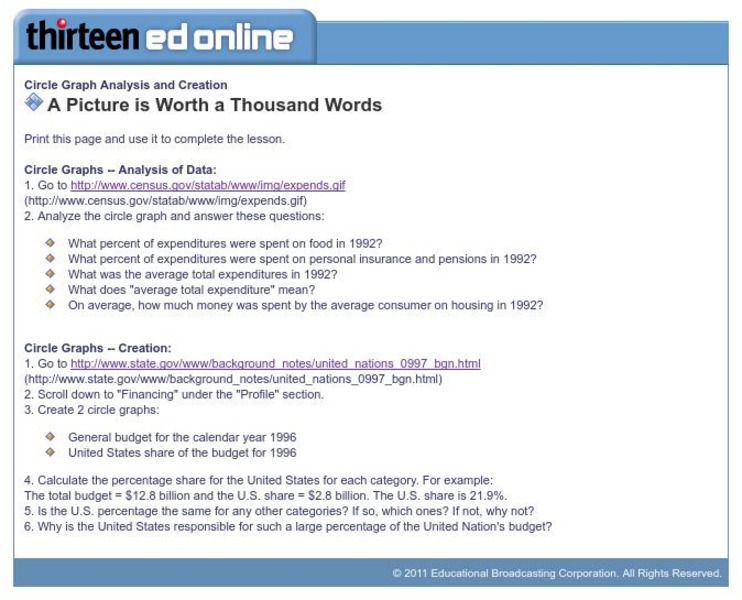
Wnet: Thirteen: Circle Graph Analysis and Creation
This site, which is provided for by WNET, gives a great way to practice using circle graphs through these exercises. One is analyzing a pie graph from the Census Bureau and the other creating pie charts using government data.
US Department of Education
National Center for Education Statistics: Create a Graph Tutorial
This tutorial walks students through how to create different types of graphs using the Create a Graph tool available on the website. Covers bar graphs, line graphs, pie charts, area graphs, scatter plots, and dependent and independent...
Texas Instruments
Texas Instruments: Grandparents and Special Friends Day
This lesson was designed for our Grandparents and Special Friends day. It can be used for any visitation day, or an open house. The lesson is designed to review percent of a whole and the sector of the circle representing the percentage....
Texas Instruments
Texas Instruments: Math Today the Next Frontier for Flight
This activity provides students the opportunity to gain experience in creating circle graphs on the calculator and provides an excellent real-world review of computation with percents.
Alabama Learning Exchange
Alex: Great Golly Graphs
This lesson plan asks students to create a survey project including graphs, questions, tables, and data analysis. It gives an assessment and ideas for remediation and extension as well as ways to manage behavior problems and reluctant...
